Safety Aspects
The word safety in any experiment is the most important word because it is important that we do not hurt ourselves. The safety aspects of this experiment is that I should wear eye protection and be careful not to spill any hydrochloric acid on my hand of face or anywhere else for that matter because hydrochloric acid is corrosive. This will be for both experiments.
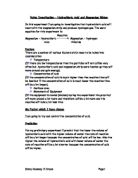
Plan of Preliminary experiment – Diagram
What my results table is base on
Equipment
Hydrochloric Acid
Water
10ml Measuring cylinder
7 Test Tubes
7, 3cm Magnesium Strips
1 Test Tube Rack
Stop Watch
Method
What I am going to do in this experiment is I am going to firstly measure out 10 ml of hydrochloric acid and put it into a test tube and add 1 magnesium strip. Then start the stop watch and watch to see how much time it takes to stop the bubbling. Each time I do this I will add water to dilute the acid to get the concentration to decrease. I will do the volumes 9, 8, 7, 6, 5 and 4 adding water to make the volume up to 10 ml.
Results 1
Graph 1
Results 2
Graph 2
Average of Results 1 + 2
Graph of Average Results of 1 + 2
What happened
What happened was the higher the concentration of acid got the less amount of time the reaction took and the lower the concentration of acid the longer the reaction took.
My Experiment 2 – The Investigation
Prediction
For my other experiment I predict that the lower the volume of hydrochloric acid with the higher the volume of water, the volume of gas left in the measuring cylinder will be less. Also the higher the volume of hydrochloric acid with the lower the volume of water, the volume of gas left in the measuring cylinder will be greater
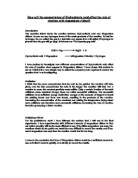
Diagram
Equipment
Hydrochloric Acid
Water
20ml Measuring Cylinder
100ml Measuring Cylinder
Conical Flask
14, 3cm Magnesium Strips
Stop Watch
Water Bowl
Tube and Stopper
Method
What I am going to do in this experiment is firstly measure out 20 ml of hydrochloric acid. Place 2 magnesium strips into a conical flask and put the lid on. Fill a 100 ml measuring cylinder into a half filled bowl of water. Then make sure that the tube coming out of the conical flask is connected up in the measuring cylinder so no bubbles can escape. Then add the 20 ml of hydrochloric acid in the tube at the top and switch of the stop watch and time how long it takes for all the water to leave the measuring cylinder. Each time I do this I will add water to dilute the acid to get the concentration to decrease. Do this time for all other volumes. I will do the volumes 18, 16, 14, 12 and 10 adding water to make the volume up to 20 ml
In all of the results of my investigation the timing will be 20 seconds because that is the time that my preliminary results gave my the idea to do.
Results
These are graphs of my results
What happened
What happened was the concentration of acid went up and so did the volume of gas.
Preliminary Results and the Investigation
The preliminary results helped me to write out my plan for my investigation by using the timings to help my work out how long I should wait before stopping the timer and taking the tube out of the measuring cylinder.
Analysing and Concluding
Patterns on the graphs which I notice for my preliminary result graphs are that on graphs 2 and the average of both graph 1 and 2 is that the slope is a lot more curved which means that the results are more constant than spread out. On graph 1 of my preliminary results the shape of the graph is a lot less curved which means that the results are a lot less constant than my other results. On my graphs for my investigation the graph for average volume of gas is very constant along the line of best fit. What I found out from the results of my preliminary results was that the lower the volume of hydrochloric acid with the higher volume of water the rate of reaction was a long time. I also found out that the higher the volume of hydrochloric acid with lower volume of water the rate of reaction was a shorter time. In my investigation I found out that the lower the concentration of acid the lower the volume of gas and so the higher the concentration of acid the higher the volume of gas. This was what I said in both of my predictions which meant my prediction were correct. My results help me to make this conclusion for my preliminary results because my results tell me that when the volume of acid goes up the amount of time goes down and when the volume of acid goes down the amount of time goes up. For my results of my investigation they help me to make this conclusion that when the concentration of acid goes up so does the volume of gas but when the concentration of acid goes down so does the volume of gas.
Evaluating
I could improve my preliminary experiment by using a bigger size up of test tubes and using 2 magnesium strips with the same amount of hydrochloric acid see how long the magnesium strips take to dissolve then. In my Investigation I could improve this experiment by using a bigger measuring cylinder and doubling the amount of hydrochloric acid and the amount of magnesium strips that go into the conical flask. There were only a few anomalous results in my preliminary results from ‘Graph 1’ – the co – ordinate is concentration of acid – 0.80 and time – 447. This result is probably anomalous because the timer may have been started a little late of more water was put into the test tube than there was supposed to. Another anomalous result from my preliminary results was on the ‘averages’ graph with the co-ordinate concentration of acid – 0.80 and time – 354. The only reason why this is anomalous is because the result from ‘graph 1’. There were only a few anomalous results from my investigation from ‘graph 2’ there was the co-ordinate concentration of acid – 1.40 and volume of gas – 56 this could have been caused by the timer being switched on a bit earlier than it was supposed to.
Emma Caveney 11 Shave Page