As you can see, there are no results in this table where it has taken too long for the reaction to take place. This helped us decide how long to test the reaction for.
Data recorded for a 3cm piece of Magnesium ribbon at 90 Seconds
The second experiment we conducted was to take into consideration that the surface area / amount of the Magnesium could affect the outcome and our results. We tested to make sure that the ratio of Magnesium ribbon to Hydrochloric Acid concentration would not make them react too quickly or too slowly as if so a pattern or trend would not be clearly shown. These results are shown below.
1cm piece of Magnesium ribbon x2
2cm piece of Magnesium ribbon x1
3cm piece of Magnesium ribbon x1
Comparing the tables above, I can make an easy judgement as to which amount of Magnesium ribbon intended to use in the main experiment. The 3cm piece of Magnesium ribbon is the best amount to use as it gives a wide range of results, it is a fairly slow reaction at 0.5 molars but it is a perfect example to use as the results at 60 seconds range from 13 to 64cm3.
After extensive testing on key areas in affecting the reaction and how we are going to control the variables we have used our preliminary experiments to decide what parts of which we are going to use in our main experiment that will give us the best possible set of results.
Here is a list of the factors we will be taking into account for the main experiment:
- We will use a 3cm strip of Magnesium; it was the most successful length for the best results.
- The concentration of HCl Acid will be recorded at 1, 1.2, 1.4, 1.6 and 1.8 Molar as this is not too high or low concentration for the amount of Magnesium we will use.
- The volume of HCl Acid will be 100ml.
- The length of time for record data will be 60 seconds.
-
Will be tested at room temperature approximately 270C.
- Reaction will take place in a conical flask and will be measured in an upturned Measuring Cylinder.
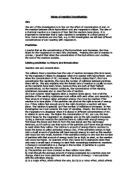
Method
Equipment needed:
- Conical Flask
- Sink Bowl (Approximately 50cm Length x 40cm Width x 30cm Depth)
- 100ml Measuring Cylinder
- 250ml Measuring Cylinder
- Magnesium Ribbon (Cut into 3cm Strips)
- Stopwatch
- Hydrochloric Acid (Of selected Concentrations 1,1.2,1.4,1.6,1.8M)
- Water
- Delivery Tube
- Bung
-
Clamp and Clamp Stand *Optional
1. Collect the equipment as shown above. Clamp and Stand are optional if you cannot hold the 250ml Measuring Cylinder upright yourself.
2. Fill the Sink bowl half full and fill the 250ml Measuring Cylinder to the top, both with tap water.
3. Turn the Measuring Cylinder upside down inside the half filled bowl making sure it is airtight and there are minimum possible air pockets at the highest point of the Cylinder.
4. Fill the 100ml Measuring Cylinder exactly of the selected Molar and pour it into the Conical Flask.
5. Place the end of the Delivery Tube underneath the upturned 250ml Measuring Cylinder and put a 3cm strip of Magnesium in the Conical Flask and start the Stopwatch.
6. Quickly fit the Bung with the other end of the Delivery Tube tightly over the Conical Flask as quickly as possible.
7. Record the level of water from the highest point of the Cylinder every 10 seconds for 60 seconds.
8. Repeat from steps 2-7 but with the next concentration of acid and wash out the equipment.
To make the correct concentrations of the dilute acid we had to mix the Hydrochloric Acid with water in certain ratios. For 1 Molar solution we did not need to mix water with the 1M acid. For 1.2 Molar, we had to mix the solution as 60cm³ 2 Molar HCL with 40cm³ water. For 1.4 Molar, we mixed the solution as 70cm³ Acid and 30cm³ water. We carried on removing 10cm³ of water and adding 10cm³ of Hydrochloric Acid to test each time as 1.2, 1.4, 1.6 and 1.8 Molar of 100cm³ Dilute HCl.
Analysing Evidence
Below are the final results we gathered which shows two sets, as we repeated the experiment twice.
Final Results with 100ml of Solution and 3cm of Magnesium Ribbon - Set 1
Set 2
The numbers shown in red are outliers which we amended by retaking select parts of the experiment.
Averages
Key for Graphs A to F
- 1 Molar
- 1.2 Molar
- 1.4 Molar
- 1.6 Molar
- 1.8 Molar
I can see that the results show a positive correlation clearly between the rate of the reaction and the concentration of Hydrochloric Acid. The difference between 1 Molar and 1.8 is that the lowest concentration has a very even pace throughout the reaction, the water level falls at an average of 6.5cm3 every 10 seconds whereas the highest concentration begins to react very rapidly in the first 10 seconds at an average water loss of 37cm3 but then the reaction slows down to about a rise of gas at 1.6cm³ per second, then 0.55cm³, then 0.2cm³ twice and finally 0.6cm³ per second at 10 second intervals.
Looking at 1.2, 1.4 and 1.6 Molar there is a range of a water level drop between two data records at a highest of 21 which is in the first 10 seconds of 1.6 Molar and a lowest of 3.5cm3 at 50 to 60 seconds on 1.6 Molar. I have noticed that the higher the concentration of Hydrochloric Acid, the faster the rate of reaction is, essentially in the first 10 seconds of the reaction.
Another factor I have found is that at 60 seconds, the higher concentration of acid in turn results in more water lost by the end of the recorded time. For example, at 60 seconds 1.8 Molar HCL has an average of 64.5cm3 of Hydrogen Gas collected in the tube, yet 1 Molar has only 35.5cm3. This suggests that 1.8 Molar has a speed of reaction nearly double 1 Molar after 60 seconds. Whereas at the beginning of the data 1 Molar is at 3cm3 of Hydrogen gas and 1.8 Molar is at 37, this suggests the reaction is around 12.3 times faster which tells me that when there is a higher concentration of acid, it will react alot faster at the beginning but will then slow down towards the end, however, a weaker concentration remains at a constant rate and may even speed up as the average data shows at 30-40 seconds of 1 Molar the level of Hydrogen rises by 4.5cm3 yet at 40-50 seconds it rises by 8.5, nearly double the reaction rate.
The error bars for the results are fairly small, this is better as it means the results are more reliable and can give a more accurate conclusion. The error bars for 1 Molar are small as the largest error bar for this level of concentration is a range of 5cm3 at 40 seconds and the smallest error bar is a range of 1cm3 at 60 seconds which is a very reliable set of data. There are some overlaps of error bars between each piece of 10 second data such as at 40-50 seconds, but this may be because of outliers and because the gap between the two results may be small anyway.
There is not distinctive trend that is easily spotted on graph F, other than when the reaction begins the higher concentrations of acid have a higher rate of gas produced per second in cm³. But they rapidly drop in reaction rate by 10 to 20 seconds and level out with the lower concentrations, 1, 1.2 and 1.4 Molar. By the last 10 seconds of the reaction there is only a range of around 0.25cm³/sec gas produced between each concentration and speed of reaction.
These results can be explained by collision theory where the molecules from Magnesium and Hydrochloric Acid collide with each other. The amount of collisions is increased when the concentration is increased which explains why the reaction is quicker; furthermore, a higher concentration means there are more particles within the same volume so consequently, more collisions are likely to occur. But molecules need to be moving with enough energy to break bonds between atoms so not all collisions are successful. To bring an example into this theory, my average gas produced per second graph for the averages results table shows that 1.8 Molar HCL has a fastest rate of reaction at approximately 3.7cm³ per second, yet 1 Molar only has a fastest rate of 0.85cm³/sec.
Data Collection
There are other factors which may possibly affect the outcome of the reaction and this may change the results, these may include:
- Temperature of the environment e.g. Room temperature, humidity etc., Water temperature. These may have a large effect on the outcome as molecules move faster with higher energy in higher temperatures so this would increase the number of collisions with other particles.
- Time between putting Magnesium in Acid and placing the bung on tight.
- Surface Area. As said before this could play a part in affecting the reaction as we demonstrated in the Preliminary work that there is more contact between the solution and the surface of the Magnesium.
- Oxidized surface of Magnesium, loss of electrons in metal may affect reaction rate.
To ensure these factors do not affect an investigation, they should be taken into account and the experiment should be repeated as many times as possible so it reduces the chance of outliers and so you can make reliable averages with your collected data. In my graphs there are few outliers and this proves the experiment is accurate. These odd results stand out well from the others so I can trust the rest of my results.
Evaluation
Although my results can be fairly trusted in their accuracy and reliability, there are some key factors which would help in increasing trust in the final data. These are parts of the experiment we could have modified / considered if we come to do this experiment again. To begin with, a fairly obvious point would be to repeat the experiment at least 4 times which would leave a small number of untrusted outliers and increase the quality of average data. Apparatus that could have aided us to increase our accuracy may have been a gas syringe which will have cancelled out some of the variables we encountered and it is less liable for factors to go wrong. We found that the Measuring Cylinder still worked the best as there was no way of getting an incorrect water level at the beginning of the experiment and there is more supply of Measuring Cylinders. A third factor could be that we should have set a longer time to record the data; this will have helped to give us more information for the weaker concentrations of Hydrochloric Acid. The problem we faced was that at 60 seconds where we stopped recording the information, there was still alot of the Magnesium still left to react. We could have tried in the Preliminary to record for about 70 or 80 seconds to see whether it will have been worth including the extra time in our experiment but no longer than 90 seconds as the Magnesium will have dissolved too early.
Overall I think this investigation was a success in proving that the higher the acid concentration, the faster the chemical reaction will take place. Despite the anomalous results that we encountered it is fair to say our results are reliable enough to come to an accurate conclusion. If the factors I have mentioned that needed changing were taken into consideration for the experiment and were put into practice it would be even greater of an extremely accurate and reliable investigation. Our experiment showed us first hand that acid concentration does significantly change the speed of the reaction and it supports my prediction. So I am extremely confident that I have collected relevant and accurate information which proves the Hypothesis and it is completely backed up by the experiment.
By Guy Collishaw