Ohm’s Law
Resistance is measured in ohms. One ohm is represented with the symbol: Ω
The greater the number of ohms, the greater the resistance present in a wire.
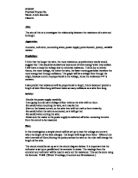
The image on the right shows the relationship between voltage, current and resistance. It can also be understood through the following equation; voltage = current * resistance
V = I * Ω
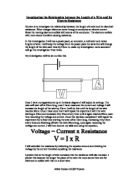
Relationship between current and voltage when a resistor follows Ohm's Law
The current flowing through a resistor at a constant temperature is directly proportional to the voltage across the resistor. Following those guide lines we can come to believe that if you double the voltage, the current also doubles. This is called Ohm's Law. Figure 5 (left) shows what happens to the current and voltage when a resistor follows Ohm's Law.
Relationship between current and voltage when a filament lamp is present in a circuit
A filament lamp is a typically bulb found in many circuits. This contains a filament (typically tungsten) which heats up when an electric current flows through it and creates light. This can be seen by figure 7.
The filament lamp doesn’t follow Ohm’s law. The resistance of the lamp increases whilst the temperature of it increases and, due to this the current flowing through the filament is not directly proportionate to the voltage across it. Figure 6 shows the graph which conveys the relationship between the current and voltage for a filament lamp.
Variables
During this experiment, our independent variable (which will be changed) is the length of nichrome wire.
In order to collect our results, we will measure the voltage (dependant variable) passed through a current of 0.5A whilst varying the length at which the electricity is transmitted through the wire. From this we will compare the relationship between the length of the wire and its resistance.
In addition to this, several variables must be controlled during the experiment. Essentially, this focuses on ensuring that the flow of energy throughout the current remains the same in each test, ensuring that the same current is emitted for every test. The following table (table 1) explains this.
Equipment
Method
- Clear your workspace, this will make your working area safe for you and your class mates and ensure that there are no accidents.
- Place chairs/stools under desks.
- Clear the desks of paper, books, bags etc. and simply have a pen and results table in order to record your results (following the steps below you will find out how to create a suitable results table).
- Gather all the necessary equipment, as previously mentioned. The Equipment is necessary in order to undergo the experiment because if all equipment is not used or set up accordingly then the data will not be reproducible.
- Set the equipment up as shown by the circuit diagram below, following this circuit diagram will increase the similarity to our experiment therefore, increasing the reliability of the results collected.
- Now that the equipment is set up, ensure that the variable power-pack is turned off with the adjustable voltage dial is turned to ‘0’, this is to make sure that the wire does not heat up before acquiring data as the temperature will affect the resistance as previously mentioned in the ‘Background’ section of this document.
- Create a results table with the following headings in a similar order. You should also include the suitable range of lengths at which you will be moving your crocodile clips in the appropriate column (wire length(cm)) For this experiment I chose to use the range of lengths; 25cm-95cm.
- Place one wire with a crocodile clip on it at one point on the 1 metre ruler, then place the other wire with a crocodile clip connected at another point 25cm’s apart.
- Turn the variable power-pack on, adjust the voltage dial until the digital ammeter has a constant reading of 0.50A.
- Record the amount of volts as displayed on the digital volt meter on your results table. for example, ‘1.28’
- Once recorded, turn the variable power-pack off and wait a reasonable amount of time so that the wire has sufficiently cooled down, this is because if the wire increases in temperature the resistance will be effected as previously mentioned in the ‘Background’ section. This could result in our results being less reliable and giving me less confidence in my conclusion.
- Then, remove one wire and increase the length to 35cm. Repeat steps 7-9. Continue to do this until you reach the length 95cm. Once you have recorded the reading for 95cm repeat the above stages 2 more times until you have repeated the range of 25-95cm with 10cm intervals 3 times.
- Now that you have repeated each length 3 times you must work out the average voltage for each length, do to this you simply add all three results together and divide them by 3 (the number of test carried out). For example, I have three results – 1.15, 1.17 and 1.12, these add up to make 3.44, then I divide 3.44 by 3 to get a mean average of 1.15.
- With the average, we can calculate the resistance In the circuit. To do this, we must multiply each average voltage by 2, this is because when using the equation for resistance we will get R = V/0.5 which is the equivalent to the average voltage multiplied by 2. Continue to do this for each length until you have done all 8 sets of data.
Pre-Tests
Change Gauge (SWG) of Wire
From viewing these results we can interpret the temperatures created when the current of 0.5Amps has been placed through the circuit. For example, when viewing the data for the 16SWG wire we can see that the voltage at 100cm is 7.76V, this high voltage could be due to the low cross sectional area of the wire and because of this the temperature would be much higher in comparison to that of the 26SWG wire which has a voltage of 0.42V at a length of 100cm. Due to the increase in temperature present in the wire the data cannot be counted as reliable as the heat of the wire affects the resistance and therefore, the voltage read by thee voltmeter (for further explanation on resistance and the cross-sectional area of a wire see the ‘Background’ section).
Also, going up a gauge of wire, at 20SWG does not provide reliable results in my opinion. This can be seen with the results at 25cm which has an average voltage of 0.07V and the other at 100cm which has an average voltage of 0.17V. The reading at 100cm was expected to be approximately 0.28V and as you can 0.17V is over 0.1V under the predicted result. This could have occurred for multiple reasons. For example, the wire may not have been straight and due to this the resistance may have been affected thus, resulting in the lower piece of data collected.
Finally, from the data gathered and the selection of resources used in this pre-test I can come to the conclusion that carrying out my final experiment in this manner would not be the best way to collect reproducible data, this is due to multiple reasons; one, there are simply not enough different pieces of wire with varying cross-sectional areas to carry out the experiment to satisfactory standard and two, the increments used are not very good for plotting a graph or conveying accurate results, the increments used in this pre-test were a follows – 4, 6, 10. This is not an even increase and would give me less confidence in my results when it came to plotting them on a graph.
Changing the Length of the Wire
Note to Miss; not sure what to say about this one.
Bibliography
(factors which affect the resistance of a wire.)