1.Temperature: If the wire is heated up the atoms in the wire will start to vibrate because of their
increase in energy. This causes more collisions between the electrons and the atoms as
the atoms are moving into the path of the electrons. This increase in collisions means that
there will be an increase in resistance.
2.Material: The type of material will affect the amount of free electrons, which are able to flow through
the wire. The number of electrons depends on the amount of electrons in the outer energy
shell of the atoms, so if there are more or larger atoms then there must be more electrons
available. If the material has a high number of atoms there will be high number of electrons
causing a lower resistance because of the increase in the number of electrons. Also if the
atoms in the material are closely packed then the electrons will have more frequent collisions
and the resistance will increase.
3.Wire length: If the length of the wire is increased then the resistance will also increase as the
electrons will have a longer distance to travel and so more collisions will occur. Due to this
the length increase should be proportional to the resistance increase.
4.Wire width: If the wires width is increased the resistance will decrease. This is because of the
increase in the space for the electrons to travel through. Due to this increased space between
the atoms there should be less collisions.
Prediction:
My scientific prediction is that if the area of the constantan wire is doubled then the resistance of the wire would be halved the previous one. Below is the equation that I have worked out and will be using to work out the resistance.
Resistance= Property of metal (constantan) x (length ÷ area)
R=p x (1 ÷ A)
I have decided that I will investigate the flow of electrons through different thickness of the wire constantan while keeping the length, material and temperature as constant as possible to make this experiment a fair test.
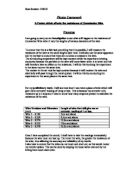
Fair Test:
To ensure a fair test I shall keep the power supply at 2 volts and I shall keep the length of the wire at 100cm by placing it on the ruler and taking the measurements and the wire must be pulled tight against the ruler and taped in place to ensure the length is accurately measured. The same circuit and battery must be used throughout as different batteries may have different voltages if they are old and that the results will be accurate and reliable a number of things must be followed
Method:
To do this investigation I will need to use several different pieces of apparatus. The apparatus that I will be using in my experiment are: -
- A Power pack -this is the main power source for the circuit.
- Voltmeter- an instrument that measures the voltage in a wire.
- 7An Amp meter- Measures the current in a wire
- A meter ruler- to measure one meter of wire and to place the one-meter wire on the ruler and take the readings, every 10cm.
- A rheostat
Before the actual experiment starts, I would first set up and test each bit of the apparatus. First I would tested the voltmeter by plugging it into the circuit then I took it out and replaced it with the amp meter to see if it was working. Then once I was happy with the equipment I set up the circuit. I connected the power pack to the ammeter. Than a connection from the ammeter to the voltmeter was made. Which was connected to one of the ends of the wire, which was placed on the one-meter ruler. The rheostat was connected to the other side on the wire. Below is my circuit diagram.
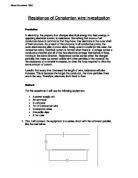
Circuit Diagram:
Then I cut a 100cm piece to constantan wire, and then cello taped each end, to the ends of the metre ruler. We took a first reading at 10cm when the circuit was set up. I took a reading every 10cm, giving me ten result for just one table. When I had got to the end of the 100cm ruler I had made sure that I had all my results filled in correctly. Between each experiment I tried to keep the temperature constant by letting a 1minute cooling down period.
Result:
Table 1
Table 2
Average Table
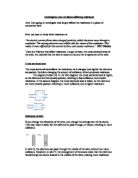
Analysis:
From carefully analysing the results in the table one both, the table of results and the graph, I say are of average quality. There weren’t really any ridiculous plots or results. The graph tells me that when the area is doubled then the resistance is approximately half then it was of the last. So this graph clearly supported my prediction.
After looking at the results of table two I would say that I didn’t test the equipment properly or take the readings correctly because the readings go up and down through out the experiment. So I think it is point less to draw a line of best fit.
In my opinion the average table show the best set of results. The line of best fit on the graph is clearer and smoother than the other two sets of results. There are no ups and downs in this set of results. This is also makes it clearer and easier to understand.
Evaluation:
I am pleased with my results and graph but if I were to do the experiment again I would change several things. The first thing that I would change would be the equipment. I would do this by making sure that each piece of equipment was new and all in working order to make sure that I could get the best results possible. The second thing that I would do is to stick to a strict limit, so that the wire and apparatus would not get to hot, this may effect the readings. Thirdly if I was to the investigation again I would, choose another variable instead of thickness. Instead I would choose the length. To do the length experiment I would need the same apparatus that I have used for the thickness experiment. The only thing that will be different is that I will be taking a reading every 5 centimetres giving me a more accurate set of results and also giving me a better plotted set of results on the graph. The wire that I will be using should still be 100cm.
Conclusion: