Aim
To investigate how the length of a wire affects its resistance.
Apparatus
Metre rule-this will be used to measure the length of the wire to 2 significant figures.
Leads- these will be used to connect the length of wire to the apparatus which will be used to measure the resistance.
Length of wire- this is what we will measure the resistance of.
Masking tape- this will be used to hold the length of wire down onto the metre rule.
Ohmmeter- this will be used to measure the resistance of the wire.
Ammeter- this will be used in conjunction with the voltmeter to measure the resistance of the wire.
Voltmeter- this will be used in conjunction with the ammeter to measure the resistance of the wire.
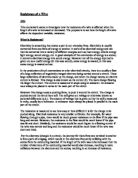
Diagram
Method
The apparatus will be set up as shown above: the length of wire (which is longer than 1m) will be placed on the metre rule and then folded over the ends of the metre rule. It will then be secured by masking tape.
Connect 2 leads to the ohmmeter. The other ends of the leads will be placed at a specific distance apart on the wire (l).The distances I will use are 10cm, 20cm, 30cm, 40cm, 60cm, 80cm, 100cm.The resistance of each distance will be taken 3 times. 7 different lengths of wire will be used. Then a wire of a different gauge and different material will be used and this method will be repeated.
This procedure will then be repeated again with the first piece of wire but a different method will be used to measure the resistance: a voltmeter in parallel to the wire and an ammeter in series with the wire will be used.
Controlling the variables
I will try to control the other variables in the following way:
- Diameter- I will only use one gauge for each particular material of wire.
- Material- I will measure the resistance of one material at a time.
- Density- I will not need to control the density of the wire as it will be fixed.
- Temperature- I cannot control the temperature but this factor may not have a significant effect on my results.
Preliminary Experiment
There are many different types of wires. A wire’s type is defined by its material and its gauge. For my preliminary experiment I will test 5 different materials of wire:
- Copper
- Manganin
- Brass
- Constantan
- Nichrome
I will try to find the resistance of 1m of wire. I used the method outlined above.
Preliminary Results
These results show that nichrome wire is the most resistant material and has a higher range. Therefore the readings would be more accurate and will be easier to measure.
Precautions
The length of the wire will be measured at an accuracy of 1cm because 0.5cm is needed to compensate for the bendiness of the wire. If it was measured to an accuracy of 1mm it measurements would be inaccurate because they would not be able to compensate for error.
We will make sure that the wire is the same temperature during each reading because if heat is exerted on the wire, the resistance will be higher.
I will take 3 readings at each distance and then find the average of those three results because it would be more accurate. If I only take one reading it would be inaccurate because that reading might be an anomaly.
I will take 7 readings because if I have 5 or below there will not be enough points to plot an accurate graph but if I use more than 9 there are too many points.
I chose those 7 specific readings because they provide a good range with which I can plot a graph.
I will use two different wire materials with two different gauges to be certain about link between length and resistance.
I will use 2 separate methods to measure the resistance of the wire to make the results more reliable.
I will use the same instrument and leads to measure the resistance during the first 2 experiments.
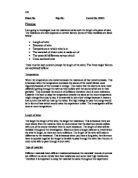
Prediction
I predict that as the length of the wire increases the resistance will do so as well because as the wire gets longer the electrons would collide more frequently with the atoms. I think that the resistance is directly proportional to length of wire because as the length doubles, there would be twice as many atoms to collide into.
This is what I think my results graph will look like.
I also think that the straight line of best fit will pass through the origin.
Results
These were the results I obtained when I tried to measure the resistance of a 38swg Nichrome wire using an ohmmeter.
These are the results I obtained when I tried to measure the resistance of a 26swg Manganin wire using an ohmmeter.
These are the results I obtained when I tried to find the resistance of 38swg Nichrome wire using an ammeter and a voltmeter.
Analysis
The first graph shows a straight line of best fit which passes extremely close to the origin. The results clearly show that length and resistance are directly proportionate: as you double the length of the wire, the resistance is doubled as well. For that experiment, there was no anomalous data. The lowest recorded reading was 5.8Ω and the highest was 57.7Ω. According to my line of best fit when the length of the wire is 0cm the resistance is slightly above 0Ω.
The second graph shows a straight line of best fit which passes relatively close to the origin. The results clearly show that length and resistance are directly proportionate: as you double the length of the wire, the resistance is doubled as well. For that experiment, there was no anomalous data. The lowest recorded reading was 0.6Ω and the highest was 3.3Ω. According to my line of best fit when the length of the wire is 0cm the resistance is approximately 0.3Ω which is quite consistent to the resistance of the previous graph.
The third graph shows a straight line of best fit which passes extremely close to the origin. The results clearly show that length and resistance are directly proportionate: as you double the length of the wire, the resistance is doubled as well. For that experiment, there were two pieces of anomalous data which I have marked out on the graph. The lowest recorded reading was 6.0Ω and the highest was 59.8Ω. According to my line of best fit, when the length of wire is 0cm, the resistance is slightly above that of the first graph. I think this was because there were more wires and instruments were used increasing the resistance slightly.
I had predicted that length of wire is directly proportional to its resistance. The results of my experiment clearly show that this is true. In the first experiment the reading for 10 cm was 5.8Ω, the reading for 20cm was 11.5Ω, the reading for 40cm was 23Ω and the reading for 80cm was 46Ω. These results support my prediction quite strongly. Length is directly proportionate to resistance because as the wire gets longer the electrons would collide more frequently with the atoms and as the length doubles, there would be twice as many atoms to collide into.
I had predicted that the straight line of best fit on my graphs would pass straight through the origin. This prediction did not come true. The lines of best fit passed slightly above the origin. This may have been because of the resistance from the wires and measuring instruments. The differences in resistance seemed to range from 0Ω to 0.4Ω which would be the typical resistance of 2 leads. When I used an ammeter and ohmmeter to measure the resistance of the wire, I found that the resistance of the wire was slightly higher than that of the first graph even though I had used the same wire. This may have been for one of two reasons:
- The heat caused by the voltage going through the wire caused the wire’s resistance to increase.
- More leads and instruments were used, increasing the overall resistance.
The pale area on each graph is the area in which a point must lie to be reliable. In this case, an anomaly is a point which is more than 10% away from the line of best fit. The pale area is within 10% of the line of best fit.
Evaluation
I think that my method worked quite well and we made it a fair test. I did this by following the precautions which I had made up. I only had two anomalies in the experiment and they both occurred when we used an ammeter and a voltmeter to measure the resistance of a 38swg Nichrome wire. These discrepancies occurred when we tried o measure the lengths 60cm and 80cm. Both of these points lied more than 10% away from the line of best fit. The only way to explain an error such as this is to say that the lengths were measured wrongly by me.
If I could redo my experiment I would:
- Use more materials and gauges and use both methods to measure the resistance in each of them.
- Make the wire straighter to make the readings for length accurate to 3 significant figures.
- Use more accurate instruments which could take the readings to a larger number of significant figures.
- Use a more accurate method to measure the length of the wire.
- Use leads and instruments with little or no resistance to make the results more accurate.
- Created an environment which controlled temperature.
I think that I carried out the experiment quite accurately and I followed all of the precautions but I encountered a slight problem when the instruments I used changed. Because the readings were not all taken in one session, I may have not used the same leads and instruments for one reading which I had used for another.
I think that my evidence was quite reliable with the exception of two results in the third experiment. My predicted graph was not exactly the same as my actual graph because on my actual graph the line of best fit did not go through the origin.
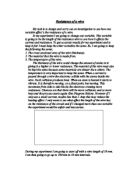
For further work we could use another method to measure the resistance of the wire: a method which is called the substitution method and is shown in the diagram below.
The resistances will be measured for the wire and the variable resistance and the resistance of the variable resistor will be changed until it shows the same resistance on the ammeter as the wire. The reading of the variable resistor will then be recorded.