- Now here is the equipment needed for this experiment:
Crocodile Clips
Wire (Constantine – see why I chose this later)
Ammeter – in order to take the current
Voltmeter – in order to take the potential difference
Power Pack
Wires
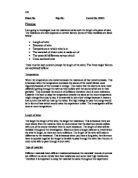
- Set up the circuit as below. First, setting the power pack up with the wires leading out of it. Then I will connect the wires to the ammeter.
- Make sure the circuit is complete and then check it before adding the voltmeter. I plan to keep one thing constant. This will be the current. For this preliminary method I have chosen to use 0.1A. This will mean I will use an easy read ammeter.
- Then I will place the crocodile clip at exactly 0.1m on the metre stick. Then I will check if the ammeter and everything are working.
- Once ready take the readings from the ammeter and voltmeter for the first 0.1m increment. I plan to take readings from 0.1m to 1m in 0.1m increments. I know it is a good idea to turn the power supply off between readings otherwise the wire will go hot.This heat will affect the resistance in causing it to increase.
- Do the same thing for the next increment 0.2m and then 0.3m and so on.
Preliminary Results
I have made a table below and a graph on the next page.
(See graph overleaf)
From my preliminary work I can see that the resistance follows a distinct pattern as it is rises 0.6 ohms at each length. I am rather pleased with my results as they are perfect but it should be different when I carry out the final experiment.
Therefore I have learnt that I am going to change the current in the final experiment to 0.2A but the lengths I have chosen seem to be good. So I will stick with the 0.1m increments up to 1m. I also know that I’m certainly going to use the constantine wire with s.w.g 24. This is instead of using copper or nickel wire. I have decided to us constantine because it keeps the resistance constant no matter what the temperature is. With copper, if the temperature changes, so does the resistance. I have gone with s.w.g 24 as it gives a nice range, an even spread on the graph. It is a nice range between s.w.g 16 to 36.
Final Method
- Take safety considerations first
- Set up the circuit as shown in the diagram below, excluding the voltmeter.
- Place the crocodile clip at 0.1m on the metre stick. Turn on the power supply and check the ammeter is working i.e. getting some current.
- Turn the knob on the power pack until the current reads 0.2A on the ammeter. This will stay constant throughout the experiment.
- Turn the power supply off.
- Then connect the voltmeter. Turn the power pack on, which is already set.
- Take the readings from the ammeter and voltmeter
- Turn the power supply off after recording the current and voltage due to the fact extra heat is generated that could increase resistance.
- Move the clip to the next increment, 0.2m. Repeat the same steps above for each 0.1m increment.
Prediction
I predict that the longer the wire, the higher the resistance. This is because in a longer wire, there are more wire particles that electrons can bump into. Resistance is caused by electrons colliding with wire particles. If there are more wire particles, the chance of an electron colliding with a wire particle will be higher.
I predict that with a wire length of 0.1m, the resistance will be lowest. I think this will be the case because in such a short wire there are not so many particles for passing electrons to collide with. I predict that at 0.2m the resistance will be higher than that of 0.1m, because of reasons previously stated. There will be twice the amount of wire particles (as 0.2 is twice 0.1), which should technically mean that there would be twice the amount of collisions.
Results
(See graph overleaf)
Analysis
I conclude that the longer the wire, the higher the resistance. This is because in a longer wire, there are more wire particles. Resistance is caused by electrons colliding with wire particles. If there are more particles the electrons are obviously more likely to have collisions, leading to a higher resistance.
The wire with the highest resistance was the longest one – 1m long. This resistance was 4.8 ohms. This was expected in my prediction. I said that the longer wire the higher the resistance, and this was the case. At the shortest length, 0.1m, the resistance was at its lowest, 0.5 ohms. The reason for this is that there are not so many particles in a short wire. Therefore there were fewer collisions between the electrons and the wire particles.
On my graph you can see that it is a steady, straight line of best fit. This suggests that length is fairly proportional to resistance. I am not surprised by this because one would expect that if you double the length, you would expect there to be double the amount of collisions and double the resistance.
So my results support my prediction well. It is quite clear that as the length of wire increases, so does the resistance. The pattern is visible in both the table and graph.
Evaluation
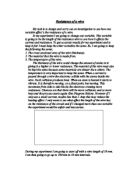
I think the experiment was fairly successful and the procedure suitable, although not as much as I would have liked it to be. For a start we used a crocodile clip to connect the wire at a certain length. The crocodile clip is fairly wide so it would be impossible to connect it to the wire at exactly the desired length. Also the wire may not have been completely straight and so we might have actually been observing the results for the exact length we intended.
I think my results were quite good and vaguely followed a pattern. This is because we used a good range of increments. The 10 increments allowed us to draw up a valid conclusion.
There were no anomalies, which proves the reliability of my results. Despite the fact there are no anomalies, my results were not directly proportional.
I think that some other failures could come down to human error e.g. I could have simply misread the ammeter or voltmeter or made a mistake when calculating the resistance. Also other factors such as temperature could have had a diverse effect on the resistance.. This extra variable would have made the experiment unfair.
If I was to repeat the experiment, I would use a wider range of results in order to increase their reliability. Also I would do repetitions with each one. For further work one could see the resistance of other wire with the temperature and width. Also you could use different resistors such as the thermistor (how resistance varies with heat) or a light dependant resistor.