Prediction:
I predict that the longer the wire the larger the resistance will be. This is because the longer the wire, the more times the moving electrons will collide with other moving electrons, the atoms making up the metal, and any impurities in the metal. Therefore, more energy is going to be lost, with longer wires than shorted, in these collisions where the kinetic energy is transferred to thermal energy. Furthermore, doubling the length of the wire will result in double the resistance. This is because by doubling the length of the wire one is also doubling the collisions that will occur, thus doubling the amount of energy lost in these collisions. On the other hand, I predict that the larger the diameter of the wire the smaller the resistance will be. This is because there is now more room for the moving electrons to move and avoid atoms, other electrons and impurities. In addition I predict that a piece of wire, of same length, with twice the diameter of another wire will have half the amount of resistance.
Equipment:
- 1m Constantan wire – I will use this wire in my pilot study and may go onto use in my actual experiment.
- 1m Nichrome wire – I will use this wire in my pilot study and may go onto use in my actual experiment.
- Mains power – I need this to connect my power supply.
- Ammeter – Used to gather and record the current flowing through each piece of wire and ensure accuracy.
- Digital voltmeter – Used to gather and record the voltage running through each piece of wire and ensure accuracy.
- Power supply – My experiment will be connected up to this. It will allow me choose a voltage that is most appropriate for my experiment.
- 2 Crocodile clips – used to connect the piece of wire to the circuit.
- Jumper wire – used to connect the entire circuit together
- 1m Ruler – used to measure the wire at different lengths. Should have mm printed on to give more accuracy.
- Masking tape – used to attach the wire to the ruler.
All the equipment I have used was used to minimize any interference possible with the wire .
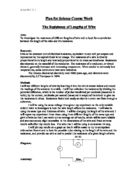
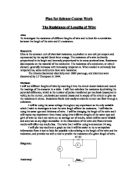
Method: this may change depending on pilot study results
- Gather all equipment.
- Assemble the circuit.
- Attach the wire to the meter stick using masking tape at both ends.
- Draw up a results table.
- Apply crocodile clips to a length of 10cm along the wire.
- Select 6v on the power supply and turn it on.
- Record the figures on the ammeter and voltmeter.
- Turn off power supply and move a crocodile clip 10cm further apart to give a gap of 20cm
- Repeat steps 7 -8 until you have data for every unit from 10cm-60cm
- Repeat steps 5-9 another 2 times on the same wire to give 3 sets of results.
- Change the SWG of the wire and repeat steps 3-10
- Repeat step 11 until all the SWG’s have been tested.
Pilot Study:
Unfortunately 6V was too high and the wire kept getting too hot and was starting to burn the equipment. I have resorted to turning down my voltage to 4.5V and starting at 20cm instead of 10cm. By doing this I am avoiding a safety hazard and lowering the temperature of the wire, sequentially decreasing the bearing on my results.
From this rough test I have decided that I will extend my range of data to 20cm-90cm. I hope that this broader range of results will demonstrate the change in resistance more so than using a small range. Furthermore, I have decided to explore the different resistances in Constantan for all the Standard Wire Gauge sizes I have available to me. This should provide more evidence in support for the hypothesis ‘a thicker wire has less resistance’. The reason I have chosen constantan instead of nichrome is because its main feature is that it has a relatively similar resistance over all temperatures. This means that it is easier for me to ensure that temperature does not affect my results.
Actual test:
Theoretical Resistance
For each wire I test I can calculate what the resistivity of the wire should be. To do this you have to know the Resistivity of the material you’re testing also the length you used and the
area of the wire. The resistivity/ohm*m, of constantan is 49x10-8 . The area of it can be seen in the following table.
Theoretical Resistance = 49*10-8 x Length (m)
Area of wire
From this table I can see what the resistance of each wire and the different lengths should be. For most of my experiment my results were rather accurate by within a 0.15 distance to the theoretical results. Nevertheless, after making a brief comparison between the two it stands out that whilst I was carrying out the experiment on constantan 36 SWG something occurred that majorly altered my results. This also occurred in a previous test where the resistance had tripled to what it was supposed to be, so I came to the decision to use a new roll of wire in order to give a more reliable and accurate result. Nevertheless it seems the results are still more than 3 points outside of the measurement that was predicted.
Interpretation:
Looking back at the experiment there are clear links between certain factors such as, when the length of the wire is increased, the voltage increases and in turn the current decreases. When this occurs, it increases the resistance. We can see this in the previous resistance equation, as the voltage increases it is being divided by the decreasing current. Consequently we are given an increasing resistance. Having a large range enables retrieving much more accurate results as it gives a much more in depth analysis of how resistance changes over different lengths. It is evident in the graph that the 36SWG wire with a length of 90cm has as much as 5 times more resistance than the 26SWG wire measured to an equal length. This is because a large cross-sectional area of a wire allows more room for the free moving electrons as to avoid contact with other electrons, atoms or other impurities in the metal. In a more narrow wire the electrons have a lot less space to move and consequently end up colliding which causes loss of energy. This collision is the cause of the resistance. When they collide, the electric potential energy stored by the electrons is transferred into thermal energy and occasionally light. This is why the wire can overheat and can sometimes revert to glowing.
It is also evident that as the length is increased a correlation between the length of wire and resistance can be seen. The graph allows us to see the resistance of a 20cm length of wire is half the resistance of that running through 40cm of the same wire. We can see that each point is pretty much equally spaced between the points above and below it. This is because as the wire increases in length by 10cm each time, the wire also increases proportionally. This increase can be seen through all the points on 60cm moving up 15% when at 70cm. This correlation occurs because as the wire length increases by 15% so does the number of atoms and freely moving electrons. This increases the chance of a collision taking place by 15%. This evidence enforces what I stated in my prediction about the effect that length and area have on resistance.
Evaluation:
I believe my results to be reliable because I repeated the experiment 3 times and achieved an average. The reliability is increased because most of my results are within 0.05V/A of my average and various other repeats. My range varied less than 1% from the mean; this is why I did not feel error bars were required.
My results are almost entirely accurate throughout the entire experiment, with the exception of the 36SWG wire. My results were within 0.1 of the distance from the theoretical resistance. I believe that this was likely to be a problem with the wire as I had the same problem before. As constantan is a wire designed not to be affected by temperature I see no reason that temperature should have influenced my results. If I had chosen nichrome instead, I would not be able to guarantee that temperature had little or no effect on my results. I strongly believe that my results are both accurate and reliable enough to support my conclusion that the resistance of a constantan wire is proportional to its length and is inversely proportional to its area.
On the other hand, in order to be completely satisfied that this conclusion is acceptable for all materials, I would very much like to repeat the experiment with a various different types of materials and lengths. There are some areas that could be adapted in order to improve the accuracy of the measurements taken. I would exchange the crocodile clips for point connectors as the width of the crocodile clips only allows accuracy to the nearest 3mm. When using other materials, the temperature could affect the resistance and cause changes that were not an issue with constantan. To maintain a constant temperature and minimize the effects of variables I could place the wire in a liquid with thermal conducting properties, but also is a poor electrical conductor.