One possible source of error is due to a temperature rise due to current passing through the wire over a long period of time. This heat will increase the error in my data because the heat will increase the resistance of the wire. By allowing current to flow through the wire for only short periods of time I hope to minimize error. Another source of error is in the inconstant diameter of the wire. To reduce this possible source of error I plan to measure the diameter of my wire along the length between 10-100cm and find an average to use in my workings. I also plan to collect all of my data in one go so I can keep all variables I want to, the same. If I collected my data in separate goes, I would end up using different apparatus at each attempt i.e. different battery. This would make my collected data unfair because some of variables that I want to keep constant are slightly changed.
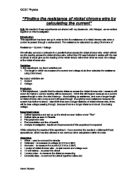
Prediction
I predict that the longer the piece of wire, the greater the resistance. This is due to the idea of the free moving electrons being resisted by atoms in the wire. There would be more collisions in a longer piece of wire, which explains the increased resistance. The relationship between the wire lengths and resistance should be proportional leaving me with a straight line graph. This is because in a wire twice the length of another, there would be double the number of atoms causing resistance.
Also when doing my preliminary experiment I predict that the larger the cross sectional area is the lower the resistance.
Preliminary Experiment
Alessandro Bizzarri
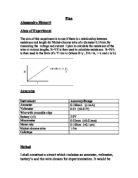
To help me choose the right wire diameter I shall do some preliminaries. I need a wire, which has a low current flow in order to keep the temperature low and eliminate one source of error. The following diagram is the one used when obtaining my preliminary results.
The following results are all from Nickel chrome of a length of 1m and the resistances were found using a multi-meter.
To keep current low, and therefore the temperature of the wire low I have chosen the diameter 0.19mm and a P.d. of 3.0V.This is because the resistance is very high so current will be low. The wire will heat up because the resistance is high leaving me with a good range of resistances between 100-10cm. I shall now work out the current that would flow through 1m of wire: -
I=V/R 3/3.6= 0.833 A
3/5.3= 0.566 A
3/15.2= 0.197A
3/21.3= 0.141A
3/35.1= 85mA * This is my desired Current.
By using these results I now know what range of the ammeter needs to be. It shall be that of 0-100mA. My school has ammeters that can measure to this range.
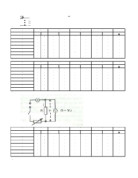
Results
Averages
Measurements of diameter of wire at 20 cm intervals
I then checked the end error of the micrometer was +0.04mm leaving me with the
final data
Percentage Errors of Apparatus
Micrometer: 0.01/0.19 × 100 = 5.26% error
Crocodile Clips: 2/1000 ×100= 0.2% error
Voltmeter: minimum error, 0.01/2.82 × 100= 0.35% error
Maximum error, 0.01/0.27 × 100= 3.70% error
Ammeter: 1mA/70mA × 100= 1.43% error all to 3 sf
My most significant source of error comes from the micrometer. When the diameter is put into the equation A=π(d/2)2 the diameter is squared so the error is doubled i.e. 10.5%
Conclusion
Alessadnro Bizzarri
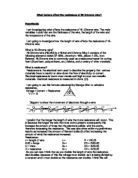
I found out that my predictions were correct. The longer the piece of wire, the greater the resistance. This is due to the idea of the free moving electrons being resisted by atoms in the wire. There would be more collisions in a longer piece of wire, which explains the increased resistance. I also predicted that the relationship between the wire length and the resistance should be directly proportional because the line pass’ through the origin. I finished with a straight line graph so this prediction was also correct. This is because in a wire twice the length of another wire, there would be double the number of atoms causing resistance.
From my graph my gradient is equal to 41/1.04= 39.42Ωm.
Gradient= 39.42Ωm.
By using the formula P= Gradient × A , I can find P.
A=π(d/2) 2 =π×(0.19×10⁻³/2) 2
Area =2.8×10⁻⁸
P=2.8×10-8 ×39.42
P=110×10-8Ωm
Evaluation
I am relatively pleased with the results obtained. I ended up with a wide range of results and my predictions were proved correct. I predicted that when I plotted R against l it would produce a straight line going through the origin. My results were accurate because on my graph nearly all of the points came into contact with the line of best fit or were very close. My techniques of measuring current and voltage were also good because the variation between repeat readings of voltage and current at each length is small.
The range of resistances between each reading is large which gives me more spread, which makes my graph more accurate.
Evaluation of results
The value I have calculated for resistivity is 110×10-8 Ω/m. I looked up my data laboratory book and found it to be 110×10-8. My unrounded value for the resistivity is 110.3×10⁻⁸ Ω/m .This is an almost identical value to that found in the book.
Sources of error
In this experiment I encountered many sources of error. The inconstant thickness of wire accounts for one of them. Although I took diameter readings along the length of wire, there could still be chinks in the wire which could affect many of my results. The crocodile clips which I used also increased error slightly. The crocodile clip was in contact with an unnecessarily large section of the wire during the experiment. Because of this, I was taking voltage and current readings for a slightly inaccurate length. This is also partly due to human error because I could have placed the crocodile clip onto the exact length I wanted. My micrometer also proved to have significant source of error. The end error of the micrometer I used was +0.04mm. The micrometer was also found to have the greatest percentage error. Its percentage error was doubled because the diameter it was used to measure was squared . (A=π(d/2)2). Measuring the length of my wire proved quite difficult because it was hard to get an accurate reading by eye. Even though the wire was cello taped to a meter rule there was some slackness in the wire proving that there was in fact more than a meter there. I managed to avoid getting the temperature too hot and so increased accuracy and reliability.
Improvements
Many of improvements could be put in place if I was to redo this experiment. I would buy a wire, which has the same diameter all the way through. I could also find an improvement to the crocodile clips. Instead of the clips I could use a jockey key. The length of wire which I would be collecting data for would be a lot accurate as jockey key comes into contact with the wire over a small distance compared to the crocodile clips.
Further work
A possible source for further work is analysing the effect of the cross sectional area of the wire with resistance. Using the equation R=pl/A in the form of Y=mx+c. Plotting R against l/A again I could predict another straight line and the resitivity would be found. This would be the same for nickel Chrome. I could also see if the equations R∝l and R∝l/A are true for other types of wire.
Bibliography
- ‘Physics’ by Tom Duncan
- Salters Horners advanced Physics
- Collins advanced modular sciences