Engineering Lab Report
AIMS 2
OBJECTIVES 2
PART 1: 2
PART 2: 2
EQUIPMENT 2
PROCEDURE 3
PART 1: 3
THEORY 4
FILTERS: 4
Fig 1 Ideal Filter 4
Fig 2 Typical Filter 5
Fig 3 Typical 2-stage Filter 5
TRANSFER FUNCTIONS AND THE LAPLACE TRANSFORM: 6
FOURIER ANALYSIS: 8
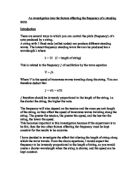
Components of a sine function: 8
RESULTS 9
LOW PASS FILTER 9
Table of Results: 9
Graph of Results: 9
Bode Plot for the Low Pass Filter: 10
HIGH PASS FILTER 10
Table of Results: 10
Graph of Results: 11
Bode Plot for the High Pass Filter: 11
BAND PASS FILTER 12
Table of Results: 12
Graph of Results: 13
Bode Plot for the Band Pass Filter: 13
STOP BAND FILTER 14
Table of Results: 14
Graph of Results: 15
Bode Plot for the Band Stop Filter: 15
2-STAGE LOW PASS FILTER 16
Table of Results: 16
Graph of Results: 16
Bode Plot for the 2-StageLow Pass Filter: 17
RESULTS FOR PART 2 17
SQUARE WAVE: 17
RAMP FUNCTION: 18
HALF WAVE RECTIFIER: 20
FULL WAVE RECTIFIER: 20
MODULATED SINE WAVE: 21
MODULATED SQUARE WAVE 21
DISCUSSION 22
CONCLUSION 23
APPENDICES 24
SIGNAL ANALYSIS
AIMS
Through experimentation of signal analysis, an understanding will be gained of a signal's behaviour when passing through filter systems of various orders. This also includes the understanding of the mathematical representation of signals and filter systems in both time and frequency domains with the use of Fourier analysis (series and transforms) and the Laplace transform.
OBJECTIVES
Part 1:
The main objectives of this exercise are to enable students:
. To construct simple analogue passive filter circuits
2. To measure performance of low pass, high pass, band pass and band stop (notch) filters and compare the practical results to theoretically computed results.
3. To get an appreciation of multistage filters.
Part 2:
Observe four different waveforms in both time and frequency domains and compare the spectrum with that of there calculated values.
EQUIPMENT
* Function generator
* Pico-scope.
* IBM PC for the Pico system.
* Patch board, test leads and components
PROCEDURE
Part 1:
Using suitable value resistors and capacitors obtain:
. A Low Pass Filter.
Demonstrate theoretically that the circuit acts as a low pass filter and sketch the gain & phase response as predicted by the theory. Perform the frequency response test on the filter then plot the results and compare with the theoretical results.
2. Repeat step (1) with a High Pass Filter.
3. Repeat step (1) with a Band Pass Filter.
4. Repeat step (1) with a Band Stop (Notch) Filter.
5. Design and construct a two stage Low Pass RC filter. Measure its performance and compare it to the theoretically predicted performance. State any precautions, which may be necessary when connecting the two stages together.
Document all results and explain all the terms commonly used in connection with filters e.g. dB points, roll off rate expressed in dBs, Corner/cut off frequency, time constant etc...
Provide suitable comments where necessary.
Part 2:
. Obtain the following signals either from a waveform generator or build circuits, which will provide the necessary signals.
a) A Square Wave
b) A Ramp Function
c) A Half Wave rectified signal
d) A Full Wave rectified signal
In each of the cases, calculate the spectrum content. Compare these values with those off of the graph obtained from the Pico scope.
2. Obtain an Amplitude Modulated (AM) signal. Apply the signal to a spectrum analyser. Explain the measured results.
THEORY
Filters:
The purpose of a filter is to do as the name suggests. A filter is used to filter out unwanted elements of the frequency spectrum of a desired signal. A basic example of an application of a filter would be in the use of a scratch filter for an old vinyl record player system. The playback from an old record contains a lot of scratches and pops due to both the production and recording of the original material and also the very nature by which it is reproduced during playback.
AIMS 2
OBJECTIVES 2
PART 1: 2
PART 2: 2
EQUIPMENT 2
PROCEDURE 3
PART 1: 3
THEORY 4
FILTERS: 4
Fig 1 Ideal Filter 4
Fig 2 Typical Filter 5
Fig 3 Typical 2-stage Filter 5
TRANSFER FUNCTIONS AND THE LAPLACE TRANSFORM: 6
FOURIER ANALYSIS: 8
Components of a sine function: 8
RESULTS 9
LOW PASS FILTER 9
Table of Results: 9
Graph of Results: 9
Bode Plot for the Low Pass Filter: 10
HIGH PASS FILTER 10
Table of Results: 10
Graph of Results: 11
Bode Plot for the High Pass Filter: 11
BAND PASS FILTER 12
Table of Results: 12
Graph of Results: 13
Bode Plot for the Band Pass Filter: 13
STOP BAND FILTER 14
Table of Results: 14
Graph of Results: 15
Bode Plot for the Band Stop Filter: 15
2-STAGE LOW PASS FILTER 16
Table of Results: 16
Graph of Results: 16
Bode Plot for the 2-StageLow Pass Filter: 17
RESULTS FOR PART 2 17
SQUARE WAVE: 17
RAMP FUNCTION: 18
HALF WAVE RECTIFIER: 20
FULL WAVE RECTIFIER: 20
MODULATED SINE WAVE: 21
MODULATED SQUARE WAVE 21
DISCUSSION 22
CONCLUSION 23
APPENDICES 24
SIGNAL ANALYSIS
AIMS
Through experimentation of signal analysis, an understanding will be gained of a signal's behaviour when passing through filter systems of various orders. This also includes the understanding of the mathematical representation of signals and filter systems in both time and frequency domains with the use of Fourier analysis (series and transforms) and the Laplace transform.
OBJECTIVES
Part 1:
The main objectives of this exercise are to enable students:
. To construct simple analogue passive filter circuits
2. To measure performance of low pass, high pass, band pass and band stop (notch) filters and compare the practical results to theoretically computed results.
3. To get an appreciation of multistage filters.
Part 2:
Observe four different waveforms in both time and frequency domains and compare the spectrum with that of there calculated values.
EQUIPMENT
* Function generator
* Pico-scope.
* IBM PC for the Pico system.
* Patch board, test leads and components
PROCEDURE
Part 1:
Using suitable value resistors and capacitors obtain:
. A Low Pass Filter.
Demonstrate theoretically that the circuit acts as a low pass filter and sketch the gain & phase response as predicted by the theory. Perform the frequency response test on the filter then plot the results and compare with the theoretical results.
2. Repeat step (1) with a High Pass Filter.
3. Repeat step (1) with a Band Pass Filter.
4. Repeat step (1) with a Band Stop (Notch) Filter.
5. Design and construct a two stage Low Pass RC filter. Measure its performance and compare it to the theoretically predicted performance. State any precautions, which may be necessary when connecting the two stages together.
Document all results and explain all the terms commonly used in connection with filters e.g. dB points, roll off rate expressed in dBs, Corner/cut off frequency, time constant etc...
Provide suitable comments where necessary.
Part 2:
. Obtain the following signals either from a waveform generator or build circuits, which will provide the necessary signals.
a) A Square Wave
b) A Ramp Function
c) A Half Wave rectified signal
d) A Full Wave rectified signal
In each of the cases, calculate the spectrum content. Compare these values with those off of the graph obtained from the Pico scope.
2. Obtain an Amplitude Modulated (AM) signal. Apply the signal to a spectrum analyser. Explain the measured results.
THEORY
Filters:
The purpose of a filter is to do as the name suggests. A filter is used to filter out unwanted elements of the frequency spectrum of a desired signal. A basic example of an application of a filter would be in the use of a scratch filter for an old vinyl record player system. The playback from an old record contains a lot of scratches and pops due to both the production and recording of the original material and also the very nature by which it is reproduced during playback.