Period of experiment overview:
My experiment developed over the time given to me in lessons. When I received the equipment, I planned out how I would arrange everything and then proceeded to carry out the preliminary experiment. I set up the equipment and carried out the preliminary (results of this and changes are seen on the preliminary experiment section). After my preliminary I carried out the main experiment and collected results, which I graphed and analysed, to reach conclusions and then evaluated my work.
Preliminary experiment
I have conducted a preliminary experiment to see how my real experiment will work out and make adjustments where necessary.
Table 2
In the preliminary experiment I increased the weight in 200g steps. This proved to be a problem as the double stranded string did not break by increasing the mass by 200g each time and this would be a bigger problem when conducting the experiment on the triple stranded string, as adding 200g masses it would take too long for the string to break (as it takes time to add the 200g mass each time) and as I am allocated two hour to conduct my experiment, then I would not be able to collect all my results that I need, as I need three sets of results for each string, thus ending up with nine sets of results. If I was to continue into the next lesson, then I would have to set up my equipment again and this is not a fair test as I might be given different equipment and the set up would not be exactly the same as it would not be the original equipment set up in their original positions. To overcome this problem in my real experiment then I will use 500g masses instead of 200g masses.
Apparatus:
-
Table: To conduct experiment on
-
Wooden Blocks: Helps to keep string steady and in place when fixed onto the G-clamp
-
Manila String: three lengths of manila string (one strand, two strands and three strands), this will be use to conduct the experiment.
-
Pulley: A smooth running surface for the wire, over the edge of the table. Hence this will let the string extend with force with minimal friction.
-
Masses: These will be used to put load on the string to give an extension reading.
-
Mass hanger: This will hold the masses that are applied to the wires.
-
G-Clamp: This will hold the wooden blocks in place which in turn will hold the string in a stationary position.
-
Sellotape: To hold the metre rule in place and to stick the marker onto the wire
-
Marker: This will be placed along each string before the experiment begins this will show how much the string extends when a force is applied to it.
-
Metre rule: Placed in a stationary position and as the marker moves when force is added to it I will be able to see the extension.
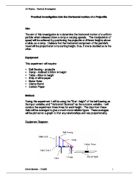
Method:
The following is a method for the experiment:
- All equipment will need to be collected, table, wooden blocks, manila string, pulley, masses and mass hangers, G-clamp, sellotape, marker and a metre rule.
- Collect manila strings together and cut to 65cm long each using the meter rule and measure the diameter of each string using a micrometer. Measurements of wire length in meters and wire diameter in millimetres (later converted to meters by dividing by one thousand).
-
Record the measurements of string length and diameter. Then work out cross-sectional area of the wire by halving diameter to get the radius of each string and then put in to the formula ∏ r², to obtain the cross-sectional area of the string.
- I will place the meter rule on the table, using sellotape to keep it steady. The G-clamp and pulley will also be clamped to the table at this time, pulley at the end of the table and G-clamp at approximately 0.7 metres from the pulley (as shown in Figure 1)
- Set up wooden bridges at ten centimetres from the G-clamp and collect string and clamp it onto the G-clamp and extend the string so it is hanging over the pulley.
- Attach mass hanger to the end of the string which is at the end of the pulley and then place the marker on the string where the metre rule reads 0 centimetres.
- Collect the 500g masses and place on 500g mass on the mass hanger. Measure the extension created by increased load. (Extension from 0 centimetres on ruler, shown by marker on string). Record extension created with this weight on a force extension table.
- Repeat step seven by adding 500g masses until the wire breaks.
Photos of my experiment
Photo 1
This is a photo showing my experiment, it shows how the masses were added on to the string (a knot was made and tied onto the mass hanger).
Photo 2
This photo shows how I made measurements of the extension, a ruler was placed side by side to the string and the string was marked with a ballpoint pen and as it extended the marked point moved and the extension could be seen.
Fair Test:
- For each string test it three times and average the results, with same conditions each time
- Carry it out all experimental work on the same day, same conditions and using all of the same apparatus.
- Keep metre stick stationary for every test, so to keep extension values fair for every test.
- Do not alter the position of G-clamp, Pulley, metre rule, wooden blocks and table during all the experiments have been completed
- All string must be manufactured from the same company and come from the same batch. All the same equipment must be used every time experiment is carried out otherwise if for example other strings are used, even though they may look the same to the human eye, they may contain atomic scale inconsistencies that could affect the results.
Safety:
- When adding masses to the mass hanger be sure not to step in the falling range of the masses as they could injure feet
- Wear goggles while conducting the experiment as when the string snaps it could take to the air in any direction and hit the eye.
- Make sure none of the equipment you are using is liable to slide or fall off the table on which the experiment is being carried out, as for example if the G-clamp was to fall off the table then it may fall onto my foot and injure me or someone else nearby. To avoid this happening then I will make sure I have a level working platform and nothing is kept at the edges of the table as it may be knocked over or fall and all equipment is secured properly to avoid injury.
Variables:
The variables will be extension & force (masses), thus this will directly affect stress and strains.
- Extension: This will change as more masses are added to the string, I will be collecting readings of extension changes until the string snaps.
- Force (via. Masses): This variable will be controlled by me, I will add masses to the strings until they snap.
- Stress & strains: This will change automatically as the extension changes when masses are added to the strings, this cannot be measured but is calculated and varies, and so is a variable.
Reliability of information:
My results will be reliable as I conducted a preliminary experiment and adapted the set-up of the equipment so that when I conduct the main experiment my results will be as reliable as can be for a classroom experiment. I will be using three different strands of strings (single, double & triple strand) and I will have three samples of each string, which I will get three sets of results for each string and then average the results to give me more reliable results (This will filter out any extreme values gained from experiments). I will follow the fair test requirements and safety procedures throughout the experiment so to keep all results reliable.
Blank results table:
I have included a blank results table on the next page to show what I used to record my data while I was in the process of conducting my experiment.
Observations
I made measurements of extension and load. I calculated stress, strain, Young’s modulus and tensile strength from the results.
My measurements are appropriate as I am investing the strength of a string and measurements of extension and load will enable me to calculate stress, strains, tensile strength and young’s modulus of the manila string.
I will be recording my measurements, calculations and results on a table and then calculate averages, stress, strains & Young’s modulus.
I measured correctly as I secured the ruler onto the table and marked on each string a mark at 30cms then examined the extension every time a load of 500g was added to the existing load acting on the material. The 500g loads were not measured by me, they were ordered by the school and I believe them to be 500g each.
I took enough measurements as I got three sets of results for each string and these results were averaged. They are enough to plot a graph and analyse it, as with the amount of results to be collected the graphs will show a pattern of correlation if there is any. There are three sets of results for single, double and triple strands and they were all collected fairly as I followed the fair test and safety precautions I stated earlier, so hence they are all accurate and not biased in any way.
My range is correct as I collected a minimum of four and maximum of 20 results for each string, this will give me enough data to plot a graph accurately.
I used my apparatus correctly to produce accurate results as the same set-up and equipment was used to obtain results for the whole experiment and the apparatus were set-up as defined in Activity 10E: experiment, in the advancing physics CD-rom AS2000 student’s version.
Table 3
Table 4
Table 5
Table 6
All of my results that I collected have been entered into a spreadsheet program on Microsoft excel. When I cut the string to length, I cut it into 650mm strips, however all my calculations are needed to be in metres. The following conversion process was used to convert millimetres into metres:
Table 7
Also needed to be calculated is cross sectional area of the manila string, which is needed to calculate stress which in turn is used to calculate young’s modulus. The “r” value is radius, which is half the diameter, so it is divided by two to give the radius. The calculations I did for cross sectional areas of all three strings is shown below:
Table 8
The stress can now be calculated by force “F” divided by cross sectional area “A”. The strain is simply average extension “E” divided by length. The average extension value was calculated by the formula =AVERAGE (cell address: cell address), this is the mean extension values. The length value “L” was a constant at 0.65m.
Table 9
Table 10
Analysis & conclusion
My results in table four to table six show that as the load increases that the strings extend and it also shows that overall stress and strains increase as load increases on the strings. I have also drawn three graphs, graph one shows how extension changes with force, graph two is a stress and strain graph and graph three is the identical stress and strain graph with error points to 3%. Overall my results show that the more strands a string has the further it extends and tables 4,5 & 6 show that it takes more force to break strings with more strands, thus proving my predictions to be correct.
All three graphs show positive correlation, thus meaning for graph one that the more strands a string has the further it extends and the more force it takes to break it and for graphs two and three the more strings a strand has the more strain it can withstand and less stress force’s it experiences. As can be seen in graph one the more strands a string has the more it extends, as for the single strand string the maximum average extension was 2.67x10⁻³m, whereas in the double strand it was 4x10⁻³m and for the triple strand it was 5.33x10⁻³m and it also shows that the more strands a string has the more force pulling down on it, it can withstand. The reason for strings with more strands extending more is that they are thicker, thus contain more atoms. As they have more atoms, these extra atoms help the material to stretch further, this can be seen simply using blue tack, as larger lumps on blue tack extend more than thinner lumps due to more atoms in the larger lump. Strings with more strands would be able to withhold more force as the forces pulling down on them are shared between the strands, thus less force per strand, this is why as can be seen in tables 4,5 & 6 that maximum breakpoints for single strand string was 2.5kgs, 5kgs for double stranded string and 10kgs for the triple stranded string, thus it could be said it takes double the force to break a strand with two strings rather than one, and double the force to break a string with three strands rather than two and so on, this is also proved in the results. As can be seen in graph two and three, that there is strong positive correlation for all three types of string. Graph one shows steep gradients for strings with more strands, however in graphs two and three strings with more stands have gentler gradients and the less strands there are the steeper the gradient, thus meaning the more strands a string has the more strain it undergoes however the less stress it experiences. Stress is force per unit area, and graph two shows that the fewer strands a string has the more force per unit area it can withstand in relation to the strain acting on it and normally hard to stretch and stiff materials undergo little strain for large stress, however the material in question is flexible and easy to stretch. As can be seen in graph two, the sting with three strands fits the action of a material that is flexible and easy to stretch as they can undergo large strain for little stress.
I stated in my prediction that I predict the young’s modulus of all three strings to be equal as they were made out of the same material and because young’s modulus is a constant. As can be seen in table ten that this is not the case, the single string has the highest Young’s modulus at 1.67x10+10 Pa and the triple stranded string has the lowest Young’s Modulus at 4.71x10+9 Pa, this is an unexpected result as I thought the Young’s Modulus would be the identical or near identical for all the strings as it’s a constant, the reason for this difference maybe that it could be a low quality cheap string so thus is not made consistently in production. I also stated that it would take more force to fracture the string with more strands in it, this is shown to be correct, as seen in graph one. As can be seen in the graph that the triple stranded string can withstand forces of up to 98N, whereas the single strand can only withstand up to 19.6N and the double strand up to 44.1N, so my prediction was correct. Although I also stated that the tensile strength of the string with more strands to be higher, table nine shows that my prediction is incorrect as it shows the single stranded string to be 69.3MPa which is the highest, whereas the double stranded string is only 39MPa and the triple stranded string is 38.6MPa. This maybe due to inconsistencies in the string during manufacturing of the wire, thus resulting in the results for tensile strength fluctuating.
There could be said to be an equation for my stress-strain graph. The graph shows characteristics of direct proportionality, so when one variable increases so does the other variable. The best fit lines show this connection. There is this connection as the lines join up to become a straight line, so it could be said stress is directly proportional to strain, for all three strings (even though there are a few anomalous points). The equation could be said to be:
Stress ∝ Strain
On graph two of stress and strain not all the points match up. I have marked these points with an orange circle. There are nineteen points with an orange circle. These points do not fit the line of best fit, this maybe because of certain inconsistencies while conducting the experiment. Graph three also shows errors to five percent, it shows how the results could have errors. The general trend in the graph is positive correlation, it shows that the higher the stress and strain values get, the bigger the error percentage gets, it means as the experiment is carried out and forces on the strings increase the results become less accurate. The error rate may increase due to the forces acting on the wire being so great that it is close to its breaking point and so becomes less stable, and as the atoms in the material stretches the way they will react would become unpredictable. Also the points may not mach up as the strings may have inconsistencies and so react unexpectedly and so create invalid results. Another reason for the inconsistent results maybe that when I added the masses I assumed that they were 500g each, however they may not have been 500g each and thus why they either caused less or more force on the strings and caused points on the graph to not all fit the trend line.
I think that the uncertainties were not big enough to affect the results as many of the points plotted were close to the trend line and many touched the trend line, however even if points were not on the trend line this would be major anomalous points and thus have not affected the results enough to make the investigation worthless.
Evaluation
My experiment worked quite well, except for my results showing that the single stranded string having a higher tensile strength than the double and triple stranded string, which was a big anomaly. Also my preliminary false start where using 200g masses caused the length of my experiment to increase due to it taking a lot more results and time to break the string, thus deciding to use bigger 500g masses to speed up the experiment so it could be conducted in one lesson and keep to the fair test requirements.
The results collected were accurate as I followed the fair test requirements to make sure all the results were collected in the same way and none were biased. Also every time I added a 500g mass to the string I waited 10 seconds for the string to settle, as when adding extra masses it sometimes vibrated and thus I waited for it to settle before adding anymore masses or recording results.
The results obtained were reliable as I had conducted a preliminary experiment to make sure no faults or problems would occur in the main experimental stage, I have collected three sets of results, each set containing a minimum off three and maximum of nineteen results, these were averaged to give me a mean result to graph. This make results more accurate as extreme values are reduced and become more accurate. I also used the same equipment and set-up to obtain all my results and the fair test rules were followed each time to give reliable results.
Possible sources of error could be my way to record the extension. I placed a metre rule across the table side by side with the string, then I marked the string at the 30cm mark so I could see and record the extension happening from that point, however as the ruler was side by side and not directly underneath then when I looked at the extension at an angle then I may have read it incorrectly and thus recorded inaccurate results, so inconsistencies would be down to human error.
The experiment could have been improved if I had more time to conduct it. As if I had more time I could have conducted the experiment with 100g masses added each time and thus collected more results and getting a more defined curve or line on my graphs, especially for the single string system, which only obtained four results under the 500g system. Also the experiment could be improved by finding to what extent there is a relationship between extension and force. This can be achieved my regression calculations using the data collected. As regression would find a law and equation connecting the variables force and extension, and also could be applied for stress and strain. It would also let me predict the extension for any given value of force using the equation that I would create using regression.
The additional work that can be done is conducting the experiment with strings with more strands in them and also different types of strings with different types of knots, to see how they react, and this can be analysed to find the strongest and toughest type of string.
Summary
Overall my experiment was successful and it helped me to analyse the strength of a string. When string is stretched the space between atoms is increased as the forces acting on them cause them to move away from each other. The energy is stored as stress and strain energies until the string reaches it breaking points and the energy is released and the string is no longer in tension, due to the force being released. The results I gained for the strings I tested on were accurate and reliable and were analysed and graphed correctly for me to reach my conclusions and evaluations.
Resources and bibliography
The resources I used were:
- Digital camera: To create evidence that I carried out my experiment and to better explain how I conducted my experiment.
- Computer: this was used to put my results on and formulas were created to create averages, stress, strains and Young’s modulus calculations.
- Computer graphs: I used excel to produce graphs with error markings, as the error markings were shown clearly when using excel when compared to hand drawn error bars, and thus resulted in better analysis.
- AS physics text book: very useful, chapter 4-5 are very useful and contained lots of information on the physics theory of my investigation (9/10)
- AS-physics CD-ROM: provided guides on how to set out coursework and information on the experiment hat this coursework was based on. (8/10)
- AS Physics teacher: Miss Bottomly: Very helpful. Introduced coursework, hence this would not have been possible without teachers help. (10/10)
-
: very good website, good introduction to what tensile testing is. (8/10)
-
: poor website for information, do not reply to emails and have little educational information about tensile testing, only selling services (1/10)
- Collins instant revision, AS physics. Published 2002. Martin Gregory. Good diagrams and graphs, basic relevant information. (4/10)
Log Book