Equipment:
Millimetre squared paper from which the parachutes are made
String from which the ‘cradle’ supporting the mass is made
Mass a constant 10g mass
Metre sticks with which we measure the height of drop
Protractor to adjust the parachute
Stopwatch to time the drop
Also:
Scissors
Glue
Process of collecting data
The process by which that I collect the data will be as follows:
- I shall calculate the dimensions of, measure out and construct a simple paper parachute.
- I shall attach string to the edge of the parachute.
- I will place a 10g mass in the newly created ‘cradle’.
- I shall time it being dropped from a measured height.
Fair test
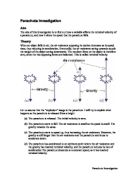
The shape of the parachute affects the way that the mass will fall, and the speed at which it will fall. We must, in this experiment, have only one variable at any given time. As the variable is the surface area of the parachute and not the shape, the circular shaper of the parachute must remain constant. We will be making the parachutes using the following method:
Use compasses to prepare a set of diameter lengths. This will be the distance directly across the middle for each parachute. Then, halve it. This will find the radius. Using these collected radii, I will substitute them into the equation ‘π R2’. This will give me the surface area of my circular parachute.
To help the parachute fall in a straight path towards the ground, I must construct a vent to deflect the air pushing up on it, rather than it simply being deflected. This vent will also be circular, so the same formula ‘πR2’ will have to be used in determining the area of the gap. This will then be subtracted from the total surface area.
After that, to make the parachute conical and therefore more parachute-like, I will measure around the parachute 45° and then multiply the total surface area by 7/8 as 45° is one- eighth of 360°.
Fig. 1. Parachute with no vent
Fig. 2. Parachute with centre vent.
Fig. 1. Fig. 2.
- Mass will always remain the same. In this experiment, as aforementioned, there will only be one variable. This variable will be the size of the parachute. The mass will always remain a constant 10g.
To be sure that a fair test is maintained, the experiment will be carried out in the same room on the same day, from the same height. This will ensure that all atmospheric conditions are the same.
Preliminary
I have already carried out a simple experiment that is very similar to this one. I have used square parachutes to drop a weight of 20g (a 0.2N mass) from a height of 2m. I then found the speed using the formula S=D/T. The results are as follows:
Size Drop 1 Drop 2 Drop 3 Avrg. Speed
A5 0.56 0.45 0.52 0.51 3.92m/s
A4 0.81 0.79 0.82 0.80 2.50m/s
A3 1.30 1.23 1.27 1.26 1.58m/s
As evident from the results, the larger the parachute, the lower the terminal velocity of the mass. Making a graph of this reiterates the point that, as there is a greater surface area, there is a greater amount of area for the air to hit and cause air resistance.
My range
As my experiment is using circular parachutes, the figures must be in Cm2 and not in paper sizes. I have decided to use a range of results from 8cm diameter to 60cm diameter at 2cm intervals. This will give me accurate results that I will be able to plot on a graph. The sheer volume of results should also make any anomalous results obvious right away.
Prediction
I predict that the greater the surface area, the lower the terminal velocity. I have decided this from not only the preliminary results, but also the formula:
Force is proportional to acceleration multiplied by velocity squared multiplied by the density of air, or:
F=Av2 x density of air.
F= force of air resistance
A= acceleration
V= velocity
At terminal velocity, weight is equal to the force of air resistance. This means that the equation can be re-arranged to read:
Weight = Av2 x density of air.
I want to find the terminal velocity in relation to the other factors, so it must be re-arranged so that ‘V’ is alone on the right hand side of the equation:
Weight = Av2 x density of air.
V2 = weight / acceleration x density of air
V = sqrt (weight / acceleration x density of air)
Using this equation, I can predict that the graph of results from my data will not be a straight line. Nor will it have a line of best fit. I have also concluded this from my preliminary results; the graph that I have drawn from these results is a curve.