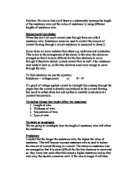
Equipment: We will be using: A Perspex beaker,
Strips of bubble wrap,
A thermometer,
A stopwatch,
A kettle,
And Hot water.
Method: 1) Set up the equipment
2) Boil water to 80c
3) Poor the water in to the beaker and start the timer.
4) Take the temperature every minuet for 20 minuets
5) Repeat this 3 times with that many layers of bubble wrapper around it.
6) Repeat steps 1-5 adding 1 more layer of bubble wrap around the beaker each time. Until u have 18 sets of results (3 for each layer).
Diagram:
Repeating: Each time the experiment is performed it needs to be performed another 2 times (this makes the experiment performed 3 times in total) to make sure the results are accurate and so you can find the average by adding all 3 results together and dividing by 3.
6 layers: We have done the experiment with 6 different layers because that way you will get a varied set of results and on the graph it is easier to see what happens as you put more layers of bubble-wrap around the beaker.
Observing: Because it was a cold day in some lights you could see the heat escaping from the beaker. Almost everything went well and there was 1 technical glitch. That was that our original plan was to wait till the water temp got from 80c to 20c and that got scraped because it was taking to long, so we were then running out of time to do the experiment the other way, so we ended up with only doing the 2nd experiment twice. But I think some of the results may not be perfect, as sometimes we didn’t see that the timer had got to a minuet and took the temperature a few minuets after.
Measuring: I think our measurements were quite accurate but because the experiment changed the averages I get may not be correct as we only got to do the experiment twice. The reasons we were meant to do the experiment 3 times was because it help to double check the results.
Recording: See table
Units: The units I have used are Minuets (min), Celsius (c) and degrees ( ).
Graph info: On my graph I will be plotting a line graph with the averages.
Graph: (see graph paper)
Relationships: The graph show that the more layers of bubble-wrap then the less heat was lost. Because we varied the amount of layers of bubble wrap this has helped me to show that our theory was true, the more layers of bubble wrap around the beaker the less heat it lost.
True?: Was our theory true? Well yes it was we said that the more bubble-wrap round the beaker did stop more heat from escaping.
Science bit: I understand how the science bit fits in but it is hard to explain in words on to paper. But basically because the heat couldn’t make the atoms in the bubbles bang (because the gap was too large) in to each other then the heat could not be transferred and was just reflected back again.
How good was the method?: I think the method was good and worked well and it didn’t affect our results because it was the right method to use.
How good are the results?: The results are good except that we didn’t get the last set of results because we ran out of time to do the experiment again. There are a few results that don’t fit the pattern and that is probably because we took the temperature at slightly the wrong time, but most of the results do fit in the pattern.
Can the method be improved?: I don’t personally think that the method could have been improved but I do think that we should of checked the original 1 for glitches first and then we wouldn’t of had to change the method and end up with only 2 sets of results because we ran out of time. The Results could have been more reliable if we had had a buzzer on the stopwatch that went off every minuet so we could tell when to take the temperature.