Concentration of aspirin- This is a varied for different results, but will need to be kept constant for each repeat of the same concentration, and must be accurate. Each concentration will be made by mixing 0, 0.5, 1, 1.5 or 2 aspirin tablets with 30 ml of distilled water. The water will be measured using a syringe, which will give accuracy to the nearest 1%.
Concentration of hydrogen peroxide- The hydrogen peroxide solution will be diluted carefully using 1 mol dmˉ³ hydrogen peroxide solution and distilled water, to the concentration determined in the pilot experiment. The measurements will be made using syringes, which will deliver accurate volumes of the solutions. All of the repeats will be made using hydrogen peroxide from the same batch, this will ensure that even if the concentration is slightly different to that stated, each repeat will have an equal concentration.
Concentration of catalase (liver solution)- Because the concentration of catalase could be different in different parts of the liver, all of the repeats will be performed using the same batch of liver solution. The liver solution will be made to a concentration determined in the pilot experiment.
Volume of hydrogen peroxide, liver solution and aspirin solution- These need to be kept constant by measuring them accurately. They will be measured using syringes which should deliver accurate volumes within 1% of the reading.
Volume of oxygen produced in the reaction- This is measured using the manometer gauge, it can be measured to the nearest 0.5mm This gives an error of ± 0.8 mm³ for the volume of oxygen produced. Approximately 60mm³ of oxygen is produced this gives a percentage error of around 1.3 %. This is very accurate.
Pilot
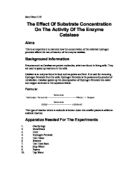
The aim of this pilot investigation is to find a concentration of hydrogen peroxide and concentration of liver which will cause the reaction to occur at a suitable rate.
The rate of the reaction must be fast enough to produce enough oxygen for it to be measurable, but must not be to fast as this would make it difficult to measure and the reaction would be completed too quickly. Hopefully the reaction will produce approximately 60mm³ of oxygen in about 30 seconds, this would move the manometer bubble by 20mm. Increasing the concentrations of hydrogen peroxide and bovine liver catalase will increase the rate of reaction because there will be more collisions between the active sites of catalase and the hydrogen peroxide.
Method for pilot
The catalase solution is made by liquidising the liver with water. The first concentration I will attempt will be 100g of liver with 200ml of water, once processed it will be filtered through a funnel with filter paper (see fig.2 on page 8). If this concentration is not suitable other concentrations will be attempted until an appropriate concentration is found.
Hydrogen peroxide solutions will be made using various dilutions of 1 mol/dm³ hydrogen peroxide. Each will be tested to the most suitable concentration.
To carry out the experiment measure 1ml of liver solution, and put it in the test tube. In the final experiment the liver solution will need to have 2cm³ of each of the different aspirin solutions added to it and 2cm³ of pH 7 buffer, but in this pilot I will add 4cm³ of water (see fig.1 on page 8). The bung should be placed on the test tube, then 2cm³ of the hydrogen peroxide should be added. The manometer is pushed into the bung the placement of the bubble is measured and timer is started. The manometer bubble should move as oxygen is produced by the reaction, the time taken for the bubble to move 20mm should be measured.
Results of Pilot
Table 1. Finding appropriate concentrations of liver and hydrogen peroxide
In the final experiment the following volumes and concentrations of solutions will be used:
1ml of 1 mol/dm³ Hydrogen peroxide
1ml of 1.4% Liver solution (made a batch in pilot)
2ml of Aspirin solution (varied concentrations)
2ml of pH 7.0 Buffer solution
Equipment
Test tubes
Test tube rack
Syringes
Beakers
Blender
Funnel
Muslin fabric
Manometer gauge (2mm diameter)
Bung (fits manometer and test tube)
Stopwatch
Gloves
Water bath (30°C)
Stirring rod
Chemicals/materials
1 mol/dm³ Hydrogen peroxide
Calf liver
pH 7 Buffer
Aspirin tablets (300mg)
Distilled water
Accuracy of equipment
Syringes- These give a reading which is ±1% of the actual volume, this is very accurate and make syringes a suitable piece of equipment for measuring out volumes of the different solutions used.
Manometer gauge- The manometer gauge can be read to the nearest 0.5 mm using the markings along it. This gives an error of ± 0.8 mm³ for the volume of oxygen produced. Approximately 60mm³ of oxygen is produced this would give a percentage error of around 1.3 %. This is very accurate.
Stopwatch- This gives a time reading accurate to the nearest second, so the error is ±0.5 seconds. Assuming that the reaction takes about 30 seconds this gives a percentage error of about 3%, this is quite accurate.
Method
(see (fig1 and 2) for further explanation )
- Make a liver solution: Put some liver, approximately 100gm, in to the blender with 200ml of water, blend it until the mixture is smooth. Filter the liver solution through a funnel with muslin fabric to remove any solid bits. The liver solution must now be diluted, in the pilot run of this investigation a solution was mixed using 1ml of liver solution to 70ml of distilled water. The same batch must be used throughout the investigation. The concentrated liver solution may be disposed.
- Making aspirin solutions: Measure out 30ml of distilled water using a syringe and add the appropriate number of soluble aspirin tablets (see table2). Use a glass stirring rod to ensure the solution is mixed properly.
Table 2. mixtures for aspirin solutions
- Measuring the rate of reaction: All solutions (in labelled beakers to avoid confusion) and glassware used must be kept in a 30°C water bath for this part of the experiment. (see fig. 1)
- Measure out 1ml of diluted liver solution, 2ml of pH 7.0 buffer and 2ml of aspirin solution using three separate syringes and put these into the test tube. Shake gently to ensure the solutions are mixed and leave for 10 seconds. Put the bung on the test tube
- Measure out 1ml of the 1 mol/dm³ hydrogen peroxide solution in a syringe. The hydrogen peroxide is added through the hole in the bung. The manometer must be added quickly after the hydrogen peroxide. Once the manometer bead is moving at a steady speed, because pushing the manometer into the bung causes some initial disturbance, a starting point for it’s movement must be noted and the timer started, when the bubble has moved 20 mm the timer must be stopped. The time taken for the bubble to move 20mm should be recorded in a results table.
- Repeat step 3 six times for each of the five aspirin concentrations
Repeats
There will be six repeats of each of the five aspirin concentrations, this will help to show whether the results are reliable or not. If the variables are controlled properly there should only be a small variation in the results. A large variation in the results shows that there is a problem with the method and that the results cannot be trusted to be accurate.
Risk Assessment
If all the precautions and procedures shown below are followed then the risks involved in performing this investigation are acceptable.
Diagrams for method
Fig. 1 Measuring the volume of oxygen produced by the catalase
Fig. 2 making liver solution
Results
Table 3. raw data-the time taken for the manometer bead to move 20mm for different aspirin concentrations.
Calculations
The volume of oxygen produced when the bead moves 20mm is π x r2 x l, which is…. π x 1 x 20 = 62.8 mm3 . To find a rate of reaction, which is in terms of the oxygen produced per second, divide the volume of oxygen produced (62.8 mm3) by the time taken.
Table 4. The rate of reactions for different aspirin concentrations.
Table 5. Average and minimum and maximum values for rate of reaction for different aspirin concentrations.
Graph
Fig3: The rate of the breakdown of hydrogen peroxide with catalase, for different aspirin concentrations, in terms of the oxygen produced; error bars show the minimum and maximum values for each data set.
Analysis
The results and graph produced from this investigation show that aspirin reduces the rate of the bovine liver catalase-aided breakdown of hydrogen peroxide into oxygen and water. Increasing the concentration of aspirin results in greater inhibition of the reaction. This supports the hypothesis that aspirin is an inhibitor of bovine liver catalase.
Because nobody has fully investigated the enzyme inhibiting properties of aspirin, it is unknown whether the inhibition is competitive or non-competitive, or active site directed or non-active site directed. The aspirin could work by binding to, either permanently or temporarily, a part of the catalase enzyme and causing a change in shape of the active site. This would mean that the substrate (hydrogen peroxide) would not fit into the active site because its shape is no longer complimentary to it. The other way that the aspirin could work is by entering the active site itself, again this may be a permanent covalent bond or a temporarily caused by the inhibitor randomly moving into the active site, in either case the substrate cannot enter the active site because it is blocked by the inhibitor. With any of these possibilities increasing the concentration of aspirin will lead to more collisions between the aspirin and catalase enzyme, which will cause a greater percentage of the enzyme to be inhibited. This slows the rate of reaction because there are less active sites available for the hydrogen peroxide to bind to, this causes collisions with uninhibited active sites to be less frequent.
Increasing the concentration of aspirin made the most difference between 0gdm-3 and 10gm-3 where the rate of reaction fell by 0.64mm3s-1, between these points the relationship between aspirin concentration and rate of reaction is shown on the graph as an almost straight line (see fig 3). After this point the change in rate of reaction compared to the increase of aspirin concentration began to reduce. This is because the percentage increase in aspirin concentration is smaller so between 5gdm-3 and 10gdm-3 the concentration is doubled, but to double the concentration again it must be increased to 20gdm-3. This is shown in the results because the change in rate of reaction between 5gdm-3 and 10gdm-3 is 0.28 mm3s-1 and between 10gdm-3 and 20gdm-3 the rate of reaction fell by 0.30mm3s-1. This trend is shown graphically as a curve (see fig 3).
Eventually if the aspirin concentration was increased further, the graph would probably level off as it reached the maximum inhibition that can be caused, however, this did not happen at the concentrations used in this investigation. This is reassuring because it means that although aspirin will affect the metabolic processes in your body, the concentrations taken by people will not have too great an effect; remember that although concentrations used in this investigation were based on the number of tablets that people may use, they were diluted much less than they would be in the human body
The shape of the graph (see fig. 3) suggests that the curve would level off before the rate of the breakdown of hydrogen peroxide is zero, this would mean that at the maximum inhibition the reaction would still occur. If this is true it suggests that aspirin may inhibit the enzyme by bonding to it in a way that alters the shape of the active site making it less of a good fit for the substrate, this way even though the enzyme is being inhibited by the aspirin, it may breakdown some of the hydrogen peroxide molecules that come into contact with it. However, this would have to be investigated further before any conclusions about the action of aspirin could be made.
Perhaps this investigation also spreads some light over the claims that taking aspirin regularly can reduce the risk of cancer, it could be that by inhibiting some of the enzymes involved in metabolism, that aspirin slows the rate of growth in cells so reduces the spread of cancerous cells. However, until more research has been made we cannot be sure.
Inconsistencies in the data
The main problem with the data is that some of the error bars are quite close to each other with one overlap between the minimum value for 15gdm-3 of aspirin and the maximum value for 20gdm-3 of aspirin (1.65mm3s-1 of oxygen produced). However, because there is a clear overall reduction and no overlaps in the rest of the data, it may be assumed that the data is beginning to overlap because the change in rate of reaction is slowing down, it may be that if higher concentrations of aspirin were used the graph would level off soon after this point.
There have been no values that have been considered anomalous as all of the values for rate of reaction are within 0.1 mm3s-1 of their average.
Evaluation
Variability of the results
Results from this investigation were not very variable with the largest standard deviation in rate of reaction being 0.09 mm3s-1. The problem, however, is that the difference in rate of reaction caused by the aspirin is quite small, this is why the error bars show some very close minimum and maximum values with one overlap. The actual values for rate of reaction seem to be quite precise because their percentage errors (based on standard deviation) are relatively small between ± 2.2% and ± 4.6%. But when the difference between results is quite small, for example between aspirin concentrations of 15gdm-3 and 20gdm-3, where the difference in rate of reaction is -0.10, the percentage difference is -6%, so a variability of ± 4.6% in the results for 20gdm-3 means that these results cannot be used to prove that there is a difference in rate of reaction between aspirin concentrations of 15gdm-3 and 20gdm-3. However, because the overall reduction between an aspirin concentration 0gdm-3 and 20 gdm-3 is large compared to the standard deviations, with an overall reduction of nearly 1mm3s-1 or percentage reduction of 37%, it is quite safe to suggest tentatively that aspirin inhibits the action of bovine liver catalase.
Limitations of the technique
The main problem experienced with this technique was that the movement of the manometer bead was never steady. The bead would stay still for a while and then jump to the next point, this is probably the main reason for variability within the results. The reason that this occurred is probably because there needed to be some pressure to make the bead move, so pressure had to build up and then would be released in one go. This is likely to be caused by surface tension in the bead, which made of a small drop of water. This produces variability in the results because depending on whether the bead was stationary or moving as it reached the 20mm displacement, there may be a period of time where the bead is nearly there and pressure must build up before it moves again, or may move immediately. Another potential problem with the technique is that only a small amount of gas is produced before the measurement is made, by having a greater amount of gas produced any small inconsistencies in the rate of reaction are evened out. This may be part of the solution to the problem of the uneven movement of the bead, because if it had further to move then the difference made by whether it is moving or stationary as it reaches the final displacement, would be small in comparison to the overall time. Another area where error may occur is the measurements of the different solutions. Although the syringes used were very accurate, an even greater accuracy could be obtained if a larger volume of the solutions is measured out, as the larger the volume measured out is, the smaller percentage error it has.
Improvements
There are two main improvements that can be made to the technique of this experiment which would help to gain more accurate and conclusive results.
Instead of using a manometer to measure the oxygen produced, a gas syringe would be used. A gas syringe measures up to 100ml of a gas, and has markings for every mm of displacement. The large volume of gas produced would help to even out any inconsistencies, and because the enzyme catalase is such a fast acting enzyme using it at a greater concentration means that producing large volumes of oxygen is quite realistic. The use of a gas syringe may also help to stop the inconsistencies of movement observed while using the manometer because it is designed to have very little friction in its movement. It also means that larger volumes of the catalase and hydrogen peroxide solutions can be used, as the gas syringe will be able to measure the larger volumes of oxygen produced.
Use larger volumes of the solutions; this increases the accuracy of the measurements made for the volumes of solution because the error becomes smaller in comparison to the actual measure made. It also means more oxygen can be produced making the measurement for oxygen production more accurate. If larger volumes of the solutions were used in the original experiment, they bubbled up the test tube into the manometer, however, if a conical flask was used the volumes of the solutions used could be increased greatly.