Neutrophils produce hydrogen peroxide as their main defense mechanism against toxins, parasites, bacteria, viruses and yeast. Neutrophils contain granules that are able to digest a variety of cellular materials. When a bacterium is engulfed by a neutrophil, the cell surface membrane invaginates in endocytosis and forms a phagocytic vacuole. The granules are released into the vacuole containing the organism. A metabolic process within the granules produces hydrogen peroxide, which destroy the ingested bacteria. Hydrogen peroxide has many advantageous uses in industry. Figure 4 shows some of them. Figure 5 shows a molecule of Hydrogen peroxide.
Plants release the hydrogen peroxide in response to the presence of a fungal invasion, which attacks by piercing the wall of a plant and breaking it down. Pectinase is a digestive enzyme derived from funguses called Aspergillus and Penicillum. It is used for the break down of the cell wall. Hydrogen peroxide is involved in stopping the action of the pectinase. It is formed and moves to the cell wall, the site of invasion. It reacts in contact with an enzyme called Peroxidase, which supports the breakdown of pectinase. Pectinase then becomes inactive.
Pilot Experiment
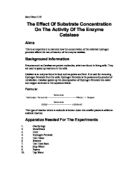
Aim:
To investigate the effect of varying the concentration of the enzyme catalase, on the rate of reaction. The volume of oxygen produced per unit of time will be measured as an indication of the rate of reaction.
Apparatus with justification:
-
Potato peeler → Will be used to remove the skin of the potato.
-
Knife →Will be used to cut the potato into cubes of the necessary quantity needed.
-
Ruler →Will be used to measure a cm3 for each potato cube.
-
10cm3 syringe → Will be used to measure the necessary amount of buffer solution
-
Buffer Solution → Will be used to keep the pH constant. A pH of 6.3 was used as catalase works best at acidic conditions.
-
Conical flask → Will be used as the container where the reactants are mixed. Also contains the buffer solution.
-
Pestle and Mortor → Will be used to mince the potato to increase the surface area.
-
Bung → Will prevents any oxygen formed in the reaction from escaping.
-
Delivery Tube →Will be used to transport the oxygen produced in the conical flask to the measuring cylinder.
-
Measuring cylinder → Will be used to measure the quantity of oxygen gas produced.
-
Hydrogen peroxide →One of the reactants.
-
5cm3 syringe → Will be used to measure the necessary amount of hydrogen peroxide
-
Stop clock → will be used to show the time intervals for taking recordings.
-
Potato →Source of catalase.
-
Container →Contains water and inverted measuring cylinder.
Safety:
Hydrogen peroxide is a strong oxiding agent and therefore corrosive. It is to be handled with care.The buffer solution will also be handled with care as it contains citric acid which is irritanat.Gloves and eye protection will be worn when handling both these reagents.The knife and potato peeler must be used safely. There are no ethical emplications to the treatment of living organisims as this was not a field experiment and was carried out in the laboratotry. If any glass were to break or any chemicals spilt, it shall be cleared away immediately. The working space will be cleared of any obstacles to avoid accidents. There are no major safety precautions taken, as flammable substances were not used in the experiment. The waste products will be disposed of safetly and responsibly. It should be noted that once these waste products are released, there is such a small quantity, that it will have no deteremental effect to the enviroment. Waste products will be neutralised or broken down to harmless substances before releasing into the enviroment.
Method:
Variables:
The dependant variable is the rate of the reaction, that is the volume of oxygen produced per unit of time. The volume of oxygen produced per unit of time from each concentration of catalase will be measured and recorded as an indication to the rate of reaction. Recordings will be made every 30 seconds for five minutes to observe how the production of oxygen proceeds over this period of time.The independent variable is the concentration of the catalase.The concentration of the catalase is to be varied by using potatoe pieces that range from the volumes of 1cm3 to 5cm3. For example to obtain a piece of potato that has the volume of 1cm3, a cube of potato will be formed that has sides with a length of 1cm so that the cube has a volume of 1cm3. To obtain potato that has the volume of 2cm3, two cubes of potato will be formed, each with the volume of 1cm3. The same method is repeated to obtain potatoes that have the volume of 3cm3, 4cm3 and 5cm3. Care will be taken to form the cubes of potatoes so that they have accurate volumes and will produce reliable results. For precision, a ruler will be used to form the potato cubes. The recordings of the volume of oxygen produced will be taken at eye level to the measuring cylinder to obtain accurate readings. The volume of buffer solution will remain constant throughout the experiment. The buffer solution will maintian the pH at 6.3 throughout the experiment. A pH of 6.3 is used as catalase works best at acidic conditions. The concentration and volume of hydrogen peroxide will also remain constant. To obtain precise quantities and to make sure that there are equal quantities in all the concentrations of catalase, accurate quantities of the buffer solution and hydrogen peroxide will be measured and obtained using a syringe. Temperaute is not a factor in this experiment so it will be suitable to be carried at room temperature. When the hydrogen peroxide is injected into the conical flask, it will immediately displace air. This must not enter the measuring cylinder as it will cause the results to be unreliable and will not be valid.
Procedure:
- Set up the apparatus as illustrated in figure 6
-
Using the ruler and knife form a cube of potato that has sides of 1cm so the cube will have a volume of 1cm3.
- Crush the potato cube using the pestle and mortor.
-
Place the minced potato into the conical flask and add 10cm3 of the buffer solution.
- Place a bung on the conical flask ensuring that there is an airtight seal. Fill approximately half the container with water. Fill the measuring cylinder with water and invert into the container. The measuring cylinder must not be placed over the delivery tube at this point.
-
Measure 5cm3 of hydrogen peroxide into the syringe, which should then be connected to the flask. Inject the hydrogen peroxide into the flask and start the stop clock. Injecting hydrogen peroxide into the conical flask will immediately displace air, which must no enter the measuring cylinder.
- Immediately place the measuring cylinder over the end of the delivery tube.
- Swirl the conical flask to mix.
- Record the volume of oxygen produced every thirty seconds for five minutes.
- Repeat the experiment using a different volume of potato.
Summary Table
As the volume of oxygen produced steadily increased with time for all the concentrations of catalase, I fixed the time at 180 seconds and worked out the rate of reaction for the different concentrations of catalase by the following method.
The results of the pilot and the graph are stated in the appendix. The rate of reaction was calculated by the following method.
Volume of oxygen collected cm3
Conclusion:
The results show that there is an obvious effect on the rate of reaction when the concentration of the enzyme is increased. The rate of reaction increases with increasing concentration. The results obtained from the experiment show that the catalase with the volume of 5cm3 had the greatest rate of reaction. The catalase with the volume of 1cm3 had the lowest rate of reaction. This is proven by the data that is shown in the summary table. The catalase with the volume of 5cm3 produced a greater volume of oxygen in the same amount of time as the catalase with the volume of 1cm3. For example, at 120 seconds, 5cm3 of catalase produced 65cm3 of oxygen whereas 1cm3 of catalase produced 0.9cm3 of oxygen. This is nearly 72 times more a volume of oxygen produced then that of catalase at a volume of 1cm3. The results also show that the rate of reaction increases with the increasing concentration of catalase. The volume of oxygen produced steadily increases with increasing volume of catalase. Using 30 seconds as an example to demonstrate this point, the results show that at 30 seconds, 1cm3 of catalase produced 0.2cm3 of oxygen, 2cm3 of catalase produced 1cm3 of oxygen, 3cm3 of catalase produced 7cm3 of oxygen, 4cm3 of catalase produced 13cm3 and 5cm3 of catalase produces 20cm3 of oxygen.
The results can be explained using the collision theory. Figure 1 shows the number of molecules in a low concentration solution and in a high concentration solution. There is an obvious greater number of molecules in the higher concentration solution then the lower. The greater the number of molecules there is, the greater the frequency of collisions that will take place between the substrate and enzyme molecules and an increased chance in the occurrence of successful collisions. This in turn will increase the rate of reaction. 5cm3 catalase had a greater rate of reaction because it had the most number of molecules in a given volume then in the 1cm3 of catalase and all the other volumes of catalase. This resulted in the molecules in the 5cm3 of catalase colliding more often and greater number of successful collisions taking place. This increased the rate of reaction. In 1cm3 catalase, there was a lower number of molecules so the molecules collided less frequently and a lower number of successful collisions occurring per unit of unit. This meant that there was a lowered rate of reaction. The results showed that the rate of reaction increased with increasing concentration. This is because as the concentration increased, the number of molecules increased. That is to say that 2cm3 catalase had a greater number of molecules then 1cm3, 3cm3 had a greater number of molecules then 2cm3 and so on. This increased the frequency of collisions, the occurrence of successful collisions and subsequently the rate of the reaction. To be more specific, the differences in the rate of reaction can be explained by what effect increasing the enzyme concentration had on the rate of reaction. Figure 2 shows how an enzyme works. The 5cm3 catalase had the greatest enzyme concentration so it had the greatest number of active sites. Due to the surplus number of active sites, the enzyme is performing at its optimum. The 5cm3 catalase had the greatest rate of forming enzyme substrate- complexes, which resulted in the formation of the products and therefore the greatest rate of reaction. 1cm3 catalase had the lowest rate of reaction because it had the least number of active sites and this meant that the enzyme was not performing at its optimum. The turnover of enzyme-substrate complexes was lowered because of this. The rate of reaction increased with increasing concentration of catalase because as the concentration increased there was an increased number of active sites. This meant that the enzyme was performing at its optimum. The turnover of enzyme-substrate complexes increases with increasing concentration and this increases the rate of reaction.
This is sufficient evidence to disprove the null hypothesis. The results are reliable and can be used to disprove the null hypothesis as the graph indicates that there is a strong correlation between the concentration of catalase and volume of oxygen produced. There are no anomalies or inconsistencies in the results. The points are all close to the line of best fit and conform to the pattern of the results. All variables from the pilot experiment will be maintained in the final experiment.
Final Experiment
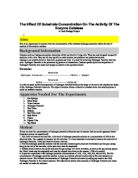
Aim:
To investigate the effect of varying the concentration of the enzyme catalase, on the rate of reaction. The volume of oxygen produced per unit of time will be measured as an indication of the rate of reaction.
Apparatus with justification:
-
Potato peeler → Will be used to remove the skin of the potato.
-
Knife →Will be used to cut the potato into cubes of the necessary quantity needed.
-
Ruler →Will be used to measure a cm3 for each potato cube.
-
10cm3 syringe → Will be used to measure the necessary amount of buffer solution
-
Buffer Solution → Will be used to keep the pH constant. A pH of 6.3 was used as catalase works best at acidic conditions.
-
Conical flask → Will be used as the container where the reactants are mixed. Also contains the buffer solution.
-
Pestle and Mortor → Will be used to mince the potato to increase the surface area.
-
Bung → Will prevents any oxygen formed in the reaction from escaping.
-
Delivery Tube →Will be used to transport the oxygen produced in the conical flask to the measuring cylinder.
-
Measuring cylinder → Will be used to measure the quantity of oxygen gas produced.
-
Hydrogen peroxide →One of the reactants.
-
5cm3 syringe → Will be used to measure the necessary amount of hydrogen peroxide
-
Stop clock → will be used to show the time intervals for taking recordings.
-
Potato →Source of catalase.
-
Container →Contains water and inverted measuring cylinder.
Safety:
Hydrogen peroxide is a strong oxiding agent and therefore corrosive. It is to be handled with care.The buffer solution will also be handled with care as it contains citric acid which is irritanat.Gloves and eye protection will be worn when handling both these reagents.The knife and potato peeler must be used safely. There are no ethical emplications to the treatment of living organisims as this was not a field experiment and was carried out in the laboratotry. If any glass were to break or any chemicals spilt, it shall be cleared away immediately. The working space will be cleared of any obstacles to avoid accidents. There are no major safety precautions taken, as flammable substances were not used in the experiment. The waste products will be disposed of safetly and responsibly. It should be noted that once these waste products are released, there is such a small quantity, that it will have no deteremental effect to the enviroment. Waste products will be neutralised or broken down to harmless substances before releasing into the enviroment.
Method:
Variables:
The dependant variable is the rate of the reaction, that is the volume of oxygen produced per unit of time. The volume of oxygen produced per unit of time from each concentration of catalase will be measured and recorded as an indication to the rate of reaction. Recordings will be made every 30 seconds for five minutes to observe how the production of oxygen proceeds over this period of time.The independent variable is the concentration of the catalase.The concentration of the catalase is to be varied by using potatoe pieces that range from the volumes of 1cm3 to 5cm3. For example to obtain a piece of potato that has the volume of 1cm3, a cube of potato will be formed that has sides with a length of 1cm so that the cube has a volume of 1cm3. To obtain potato that has the volume of 2cm3, two cubes of potato will be formed, each with the volume of 1cm3. The same method is repeated to obtain potatoes that have the volume of 3cm3, 4cm3 and 5cm3. Care will be taken to form the cubes of potatoes so that they have accurate volumes and will produce reliable results. For precision, a ruler will be used to form the potato cubes. The recordings of the volume of oxygen produced will be taken at eye level to the measuring cylinder to obtain accurate readings. The volume of buffer solution will remain constant throughout the experiment. The buffer solution will maintian the pH at 6.3 throughout the experiment. A pH of 6.3 is used as catalase works best at acidic conditions. The concentration and volume of hydrogen peroxide will also remain constant. To obtain precise quantities and to make sure that there are equal quantities in all the concentrations of catalase, accurate quantities of the buffer solution and hydrogen peroxide will be measured and obtained using a syringe. Temperaute is not a factor in this experiment so it will be suitable to be carried at room temperature. When the hydrogen peroxide is injected into the conical flask, it will immediately displace air. This must not enter the measuring cylinder as it will cause the results to be unreliable and will not be valid.
Procedure:
- Set up the apparatus as illustrated in figure 6
-
Using the ruler and knife form a cube of potato that has sides of 1cm so the cube will have a volume of 1cm3.
- Crush the potato cube using the pestle and mortor.
-
Place the minced potato into the conical flask and add 10cm3 of the buffer solution.
- Place a bung on the conical flask ensuring that there is an airtight seal. Fill approximately half the container with water. Fill the measuring cylinder with water and invert into the container. The measuring cylinder must not be placed over the delivery tube at this point.
-
Measure 5cm3 of hydrogen peroxide into the syringe, which should then be connected to the flask. Inject the hydrogen peroxide into the flask and start the stop clock. Injecting hydrogen peroxide into the conical flask will immediately displace air, which must no enter the measuring cylinder.
- Immediately place the measuring cylinder over the end of the delivery tube.
- Swirl the conical flask to mix.
- Record the volume of oxygen produced every thirty seconds for five minutes.
- Repeat the experiment using a different volume of potato.
Summary Table
As the volume of oxygen produced steadily increased with time for all the concentrations of catalase, I fixed the time at 180 seconds and worked out the rate of reaction for the different concentrations of catalase by the following method.
Volume of oxygen cm3
180seconds
The values reported in the table are an average of the two trials. The results of each trial experiment and the graphs are in the appendix.
Conclusion:
The results show that there is an obvious effect on the rate of reaction when the concentration of the enzyme is increased. The rate of reaction increases with increasing concentration. The results obtained from the experiment show that the catalase with the volume of 5cm3 had the greatest rate of reaction. The catalase with the volume of 1cm3 had the lowest rate of reaction. This is proven by the data that is shown in the summary table. The catalase with the volume of 5cm3 produced a greater volume of oxygen in the same amount of time as the catalase with the volume of 1cm3. Using the averages of trials 1 and 2 to show this point, at 300 seconds, 5cm3 of catalase produced 147cm3 of oxygen whereas 1cm3 of catalase produced 2.35cm3 of oxygen. This is nearly 62 times more a volume of oxygen produced then that of catalase at a volume of 1cm3. The results also show that the rate of reaction increases with the increasing concentration of catalase. The volume of oxygen produced steadily increases with increasing volume of catalase. Using 30 seconds as an example to demonstrate this point, the results show that at 30 seconds, 1cm3 of catalase produced 0.45cm3 of oxygen, 2cm3 of catalase produced 2cm3 of oxygen, 3cm3 of catalase produced 6.5cm3 of oxygen, 4cm3 of catalase produced 15cm3 and 5cm3 of catalase produces 21.5cm3 of oxygen.
The results can be explained using the collision theory. Figure 1 shows the number of molecules in a low concentration solution and in a high concentration solution. There is
an obvious greater number of molecules in the higher concentration solution then the lower. The greater the number of molecules there is, the greater the frequency of collisions that will take place between the substrate and enzyme molecules and an increased chance in the occurrence of successful collisions. This in turn will increase the rate of reaction. 5cm3 catalase had a greater rate of reaction because it had the most number of molecules in a given volume then in the 1cm3 of catalase and all the other volumes of catalase. This resulted in the molecules in the 5cm3 of catalase colliding more often and greater number of successful collisions taking place. This increased the rate of reaction. In 1cm3 catalase, there was a lower number of molecules so the molecules collided less frequently and a lower number of successful collisions occurring per unit of unit. This meant that there was a lowered rate of reaction. The results showed that the rate of reaction increased with increasing concentration. This is because as the concentration increased, the number of molecules increased. That is to say that 2cm3 catalase had a greater number of molecules then 1cm3, 3cm3 had a greater number of molecules then 2cm3 and so on. This increased the frequency of collisions, the occurrence of successful collisions and subsequently the rate of the reaction. To be more specific, the differences in the rate of reaction can be explained by what effect increasing the enzyme concentration had on the rate of reaction. Figure 2 shows how an enzyme works. The 5cm3 catalase had the greatest enzyme concentration so it had the greatest number of active sites. Due to the surplus number of active sites, the enzyme is performing at its optimum. The 5cm3 catalase had the greatest rate of forming enzyme substrate- complexes, which resulted in the formation of the products and therefore the greatest rate of reaction. 1cm3 catalase had the lowest rate of reaction because it had the least number of active sites and this meant that the enzyme was not performing at its optimum. The turnover of enzyme-substrate complexes was lowered because of this. The rate of reaction increased with increasing concentration of catalase because as the concentration increased there was an increased number of active sites. This meant that the enzyme was performing at its optimum. The turnover of enzyme-substrate complexes increases with increasing concentration and this increases the rate of reaction.
This is sufficient evidence to disprove the null hypothesis. The results are reliable and can be used to disprove the null hypothesis as the trial one and two and the rate of reaction graph indicates that there is a strong correlation between the concentration of catalase and volume of oxygen produced. The points are all close to the line of best fit and conform to the pattern of the results. The error bars for the potatoes with the volumes of 2cm3, 3cm3 and 4cm3 are of a small range and consistent. This indicates that similar results were obtained from trials one and two. This suggests that the results are accurate and reliable. The range of the error bars for the potatoes with the volume of 5cm3 and 1cm3 begin to increase. This difference is due to anomalies that arise in trial two. The anomalies produced in the results in trial two are due to two factors. One is that there may have been an inaccuracy when forming the cubes of the necessary volumes. This differed the volumes of the potato in trial two in comparison to trial one. The second factor is that, in trial one, when the hydrogen peroxide was in the conical flask, it was swirled more thoroughly to mix the two reactants then in trial one. The error bars show that the results of trial one and 2 produced the same pattern regardless of a few anomalies.
Evaluation:
The error bars indicate that there is not a great variability in the results obtained from the potatoes with the volumes of 2cm3, 3cm3 and 4cm3. This suggests that these results are reliable as similar results were obtained from trials one and two. There were no anomalies in this set of data, suggesting precision in the data and when the experiment was carried out. The results show a strong correlation between the two variables. Judging from these results, a sufficient conclusion can be drawn that varying the concentration of catalase does effect the volume of oxygen produced and thus can be used to reject the null hypothesis.
The error bars for the potatoes with the volumes of 1cm3 and 5cm3 show variability. This variability is due to the results obtained from trial two, which produced anomalies in the results. Due to this, the results from trial two lack a certain degree of reliability. The trial two results can still be considered as reliable, regardless of a small range of variability, as it shows the same pattern as the trial one results and the results obtained from the pilot experiment. The anomalies are not significant enough to cast doubt over the reliability of the conclusion. If the problems that caused the anomalies were taken into consideration, and the experiment was to be repeated for a fourth time, the results would still show the same pattern and the variability in results would be decreased. The results obtained from trial one and two still show the same pattern but there is variability between the two results. The evidence to disprove the null hypothesis is too overwhelming for a small range of anomalies to question the reliability of the conclusion drawn from it.
The anomalies produced in the results in trial two are due to two factors. One is that there may have been an inaccuracy when forming the cubes of the necessary volumes. This differed the volumes of the potato in trial two in comparison to trial one. The second factor is that, in trial one, when the hydrogen peroxide was in the conical flask, it was swirled more thoroughly to mix the two reactants then in trial two.
A limitation to this experiment is that there were no measuring cylinders available that could contain a volume greater then 100cm3. This proved to be a problem in the experiment as the volume of oxygen produced extended beyond 100cm3. The measuring cylinder had to be filled out with water and inverted into the container again. While the measuring cylinder was being prepared again, the delivery tube was left exposed, leaving oxygen gas to escape. This would make the results inaccurate, as correct readings are not being taken. The dependant variable is not as accurate as it can be. To overcome this problem and to improve results, a measuring cylinder with a volume greater then 100cm3 could have been used. The methodology used allows oxygen to escape in other ways. The oxygen can escape, as there is no tight sealing between the delivery tube and the measuring cylinder. The oxygen produced is collected through the water into the measuring cylinder. This allows for some of the oxygen to escape and dissolve into the water. This will also cause the dependant variable to be inaccurate. As a consequence, you are recording a lower amount of oxygen then what is actually produced. To overcome this problem, the oxygen produced should be collected through a glass syringe. This will eliminate the problem of the risk of oxygen escaping. The diagram of the proposed apparatus set up is shown in figure 8.
In terms of further investigation, the concentration of catalase from a variety of sources could have been varied to investigate the rate of reaction. This would provide a more broad, detailed investigation and a greater understanding of the effect of concentration on catalase. From this experiment, you can then obtain the average optimum concentration of catalase. The result obtained from this experiment was as expected. The prediction states what was expected. Figure 7 shows the predicted graph and this is very similar to the results obtained from the experiment. There is no variation between expected results and the actual results.
APPENDIX
PIOLET RESULTS
Results:
Final Results:
Trial 1
Trial 2
Mean Value of Oxygen produced
SINTHUJA SATHIANATHAN
THE EFFECT OFVARYING THE CONCENTRATION OF CATALASE ON THE RATE OF REACTION.
Contents
Introduction 1
Background Knowledge 2
Pilot Experiment
- Aim 5
- Apparatus with justification 5
- Safety 5
- Variables 6
- Procedure 6
- Summary Table 7
- Conclusion 7
Final Study
- Aim 9
- Apparatus and justification 9
- Safety 9
- Variables 10
- Procedure 10
- Summary Table 11
- Conclusion 11
- Evaluation 13
Appendix 15
Pilot results 16
Final Results 16
Mean results of final experiment 17
Raw data
Error bars