Moles = Mass (g)/Mr
Moles = Concentration (M) x Volume (cm3)/1000
CaCO3 + Any 1M acid ……
1 mole 100g 1000 cm3
… 0.5g 5 cm3
K2CO3 + Any 1M acid ……
1 mole 138g 1000 cm3
… 0.5g 3.6 cm3
Na2CO3 + Any 1Macid ……
1 mole 106g 1000 cm3
… 0.5g 4.7 cm3
Using these calculation, when experimenting I am able to no roughly how much acid is needed. I will use a little bit more acid than that estimated so that the acid is in excess.
Choosing the Carbonate
From these results I can see that the carbonate which produces the biggest volume of CO2 is calcium carbonate, so this will be the carbonate used in the experiment.
Choosing the Acid
Before performing the preliminary I have predicted that all the acids will release approximately the same volume of CO2 providing the acid’s concentration remains constant.
Two of the results are, as predicted, very similar to each other. However when using the sulphuric acid, much less CO2 was released. This was due to the fact that when the substances were mixed calcium sulphate was formed, and this is an insoluble solution. As a result of this not all the acid could reach and react with all the carbonate, so the CO2 released was less. The acid chosen is hydrochloric acid, and this is chosen over nitric acid for no real reason – both acids behave in a similar way.
Choosing the Range
When performing the experiment it is suitable to have about 8-10 different readings. The maximum amount of powder that we could fit into the bullet sample tube was 1.0 g. I have chosen to start with the mass of carbonate being 0.1 g, and going up in increments of 0.1 g, so the next value would be 0.2 g. I will continue to do this until 1.0 g, giving me 10 readings.
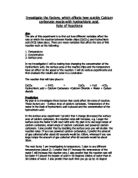
Prediction
Using certain equations as used before, it is possible to predict exactly how much CO2 will be released for different amounts of carbonates and acids.
Moles = Mass (g)/Mr
Moles = Concentration (M) x Volume (cm3)/1000
CaCO3 + HCl CaCl + H2O + CO2
1 mole 100g 1000 cm3 24000 cm3
… 0.1g 1 cm3 24 cm3
… 0.2g 2 cm3 48 cm3
In the table below, I can predict what each result will be using results proportionate to the ones worked out above.
From this table I can predict that the volume of carbon dioxide released will be directly proportional to the mass of the carbonate. Due to this, I can predict what the shape of the graph should look like:
Apparatus
Below is an apparatus list stating all the items that will be used in collecting the data, found out during the preliminary work:
Calcium carbonate, spatula, top-pan balance, hydrochloric acid, graduated flask, 100 cm3 measuring cylinder, bullet sample tube, rubber bung, delivery tube, water bath, water and a 250 cm3 measuring cylinder.
A measuring cylinder has been used as a result of the predicted volumes of gas – the most gas predicted is 240 cm3, so this size measuring cylinder is a suitable one.
Procedure
- The correct mass of carbonate will be weighed on the top-pan balance, taking away the extra weight of the bullet sample tube.
-
More than the required volume of acid will be measured using the 100 cm3 measuring cylinder, and then it will be placed into the graduated flask.
- The water bath will be filled a little over half way to allow for the water about to be displaced.
-
The 250 cm3 measuring cylinder will be filled exactly to the top, and a hand will cover the top.
- Ensuring that there are no air bubbles, the cylinder will be placed upside down into the water bath.
- After the carbonate has been placed into the sample tube, he graduated flask will be placed almost vertical, allowing the tube to rest in the neck of the flask.
- The bung connected to the delivery tube will be placed on to the flask.
- The other end of the delivery tube will be placed slightly into the measuring cylinder.
- The graduated flask will be tilted so that the sample tube falls into the acid, causing a reaction.
- The flask will be shaken until the carbonate is disappeared and no more gas is entering the measuring cylinder.
-
The reading on the 250 cm3 measuring cylinder will be recorded as the volume of CO2 released. The same procedure will then be done using all the other masses of carbonate, ranging from 0.1g – 1.0g, going up in increments of 0.1g.
- Another repeat will be taken for each result afterwards to ensure that we have recorded reliable data. If the two readings are unlike each other, then a third one will be taken to cancel out the anomaly.
Below is a diagram of all he apparatus set up in place as it would be when obtaining the results:
Diagram:
Results Table
Analysis
Graph
Looking at the graph I can see that the line of best fit is straight one, and it is also positive. The line goes through the origin, and this as well as the fact that the line is straight tells me that the relationship between the mass of carbonate and the volume of CO2 is a directly proportional one. This means that if the mass of carbonate increased by a certain factor, then the volume of CO2 would increase by the same factor.
Prediction + Theory
Being one of the two raw reactants for the products, the bigger the mass of carbonate, the greater the volume of CO2 released. If the amount of moles of carbonate doubles, then the amount of moles of CO2 doubles and hence the volume of CO2 doubles, as long as there is sufficient or excess amount of acid. Using moles calculations, I worked out what the results should have been, and that the CO2 released was directly proportional to the mass of carbonate used.
Using certain equations as used before, it is possible to predict exactly how much CO2 will be released for different amounts of carbonates and acids.
Moles = Mass (g)/Mr
Moles = Concentration (M) x Volume (cm3)/1000
CaCO3 + HCl CaCl + H2O + CO2
1 mole 100g 1000 cm3 24000 cm3
… 0.1g 1 cm3 24 cm3
… 0.2g 2 cm3 48 cm3
In the table below, I can predict what each result will be using results proportionate to the ones worked out above.
From this table I can predict that the volume of carbon dioxide released will be directly proportional to the mass of the carbonate.
Accuracy
Prediction Factors
From this table I can tell that the average percentage out is 7.18%, which shows that my results were not very accurate compared to my predicted outcomes. From the predicted graph I can state that my prediction about the mass of carbonate being directly proportional to the volume of CO2 was true. From my prediction graph, I can see that slope of my prediction graph matched the graph obtained – both of the slopes were straight and positive. Both of the Y-intercepts passed through the origin.
Limits
From this investigation I have shown that the volume of CO2 released when calcium carbonate reacts with hydrochloric acid is directly proportional to the mass of carbonate using masses ranging from 0.1g to 1.0 g. I have not, however, proved that the volume of CO2 is always directly proportional to the mass used in any carbonate/acid reaction. The limits to this investigation are that every different carbonate has not been tested, every different acid has not been tested, the volume of acid has not been tested and different masses of carbonate have not been tested. The same pattern may not apply when using these differences.
Evaluation
There are three main points to evaluate, and these are the precision, the reliability and the accuracy of the results. Firstly, the rate of precision is not very good, as the equipment used was not very precise – each graduation went up in increments of 2 cm3. Also, a plastic measuring cylinder was used, and so it was not desperately accurate, probably giving a margin of error of about 5%.
The reliability is the measure of how reproducible our results were fairly reliable, but to get even more reliable results we should have taken one more repeat – not only if we got an anomaly. On the graph I can see that all the points are very close to the line of best fit. This proves to me that if another test was taken, I would be quite confident that the result would lie on that line. The reliability of our results can be worked out as a percentage – the higher the percentage, the more variability there is in the repeats and so the less reproducible they are. The equation to work out the percentage variability:
In the table below are the results of four tests, showing their reproducibility:
From these calculations I can see that as there is an average of only 4.73% variability, the results taken were pretty reliable – the results were not too erratic, even with one result that was deemed an anomaly. This means that approximately these results will be obtained if the tests were repeated.
Using moles calculations, the predicted outcomes for the volumes of CO2 have been measured, and comparing these to our results I have already measured in percentages how large our errors were from the predicted volumes. Our average percentage error was 7.18%, which proves that our results weren’t very accurate. Looking at my results and at my graph, I can see that all the results were less than the predicted outcomes. This is because before the experiment I had overlooked the fact that some of the volume of CO2 reacts with the water used in the water bath – water to make carbonic acid, which is shown in the equation below:
CO2 + H2O H2CO3
Carbon-dioxide Water Carbonic Acid
The factor of precision, reliability and accuracy varies according to how well the procedure was planned, and how well it was implemented. The results were not really precise as the measuring cylinder had graduations going up in increments of 2 cm3, and was made of the inaccurate plastic. If even more precise reading were taken, then the points on the graph would move a bit – so in the procedure a more accurate measuring cylinder could have been produced to produce more precise results. The results were reasonably reliable as well, but to ensure even more reliable results, which would be better, two repeats should be taken rather than just one. Looking at the graph, all the points were very close to the line of best-fit meaning that the reliability was at a very high level. The accuracy was not bad, but not terribly good. The accuracy may have even been improved in a few different ways. Firstly, a more precise top pan balance could have been used, to ensure that the mass of the carbonate is accurate. Also, a great deal more acid should have been used just in case that all the carbonate did not react with the acid – much more than the required acid which had been worked out in the plan. To prevent the carbon dioxide from reacting with the water in the water bath, an insoluble liquid should have been used so that no carbon dioxide would be lost. This would greatly reduce the amount of CO2 lost, however water is one of the products of the reaction, so a small amount of CO2 would still dissolve into this.
There was one single anomaly and when this result was taken, the bung was not placed on the flask properly, and as a result some carbon dioxide may have been released causing the anomaly.
Further Work