Faster collisions are only caused by increasing the temperature. Reactions only happen if the particles collide with enough energy to make the reaction happen. This initial energy is known as the activation energy, and is needed to break the initial bonds.
Hypothesis and Prediction
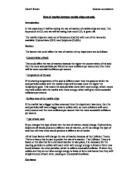
My prediction is that as you increase the temperature there will be an increase in the rate of production of CO2. Below is the graph that I will expect to get from my results:
Volume
Of
CO2
Lost
(cm3)
Temp (°C)
The graph for rate against temperature would look like this:
Rate
1/T
Temp (°C)
In Graph 1, as you increase the temperature, there will be more particles with the activation energy thus causing more collisions. This would thus cause an increase in the rate of reaction. In Graph 2, as you increase the temperature the rate decreases.
Plan
Firstly, I plan to set out the experiment as shown in the diagram below. I will then be doing three runs for five different temperatures. I will be doing 3 runs for each temperature to get a more accurate and precise result, the more runs the better but due to the amount of time given for the practical I will only be able to do 3 runs each.
Once I have gained the results, I will put my results onto graphs and then work out the rate of reaction for each by using the formula:
Difference in Y
= Rate of Reaction
Difference in X
Where the difference in Y and X is found through triangulation, where only the steepest part of the line will be analysed. I will then plot a final graph with the rate plotted against temperature to show more clearly the difference in the rate at different temperatures.
Then finally I will analyse the final graph and show what I have found and I will see whether my prediction will be proved and then to evaluate the experiment and what I have found.
Apparatus
The following equipment is required for the experiment:
- Marble chips of a mass of approximately 0.4g.
-
20ml of bench HNO3 for each run
- 1 Boiling tube
- 1 Stop-watch
- 1 Measuring Cylinder
- 1 Water bath filled with water
- 1 Bung
- 1 Stand
- 1 Bosses and 1 Clamps,1 Beaker
- Hot water
- Thermometer
- Ice
Method: The Trough Method
- Pour water into plastic container.
- Pour water into measuring cylinder, and place it upside down in the plastic container full of water.
- Place rubber tubing inside measuring cylinder.
- Clamp the measuring cylinder in place.
- Pour water (of the temperature you have chosen) into a beaker.
-
Pour 20cm3 of nitric acid into a boiling tube.
- Place a calcium carbonate chip (of what mass you have chosen) inside the boiling tube.
- Place bung firmly on top of the boiling tube.
- Start the timer as soon as you place the bung on the boiling tube.
Safety:
- Wear safety goggles.
- Hold bung from the end and not from the delivery tube to avoid injury.
- If there is hot water in a beaker, hold the beaker from the rim.
- Also place apparatus on the middle of the bench to avoid spillages and to avoid injury.
How I kept it a Fair Test:
- I kept the mass of the calcium carbonate chip at 0.48g.
-
I kept the amount of nitric acid at 20cm3.
- I equilibrated the equipment to the reacting temperature.
- I took the same amount of time placing the marble chip in the boiling tube each time.
Results
Graphs
Please refer to the appendix, there are 5 graphs, graph A,B,C,D and E
Analysis
Graph A shows that between 0 – 1:30 min there was no production of CO2. However after 1:30 min the rate of the reaction started to increase. This shows that at low temperatures, there will be a slower rate of reaction.
Graph B shows that1:30 min and 4:00 min there was a significant increase in the loss of CO2. The rate of the reaction was 9.66 cm3/min.
Graph C is similar to Graph B as the reaction starts of slowly but increases as time passes. The rate of the reaction at 27°C was 12.33 cm3/min.
Graph D is also very similar to the two previous graphs as it starts slowly but gains speed towards the end. The rate of the reaction was 14 cm3/min.
Graph E starts off very quickly but starts to taper off towards the end. The rate of the reaction was 35.5 cm3/min.
The final results show that my prediction was correct. I predicted that as the temperature is increased the faster the reaction would take place.
Cool acid particles have little energy, therefore do not collide with the marble chips very often, and for a chemical reaction to occur you need many successful collisions between the acid particles and the marble chip. The hotter the acid, the faster the collisions and the reaction speeds up. The rate of a chemical reaction is increased by increasing the temperature and alternatively decreased by decreasing the temperature.
The increase in the rate of reaction with temperature can be explained by the collision theory. An increase in temperature increases the energy of the reacting particles. This makes more energy available for the breaking of bonds, which must take place in order for a chemical reaction to occur. Bond breaking is more frequent at higher temperatures.
Increase in temperature
Of reactants
Evaluation
The procedure we used was not as accurate as others that could have been used instead. Possible reasons for errors in this experiment were:
- Top Pan Balance
- Timer
- Measuring Cylinder
- Thermometer
Another possible error in this experiment was that some of the Carbon Dioxide dissolved into the water in the measuring cylinder. The solubility depends on the temperature at which the water was. Also the size of the bubbles and the rate of production of the bubbles both contributed to the experimental error.
Experimental Error
-
Top Pan Balance: This was only accurate to three decimal places, as the mass of the marble chip had to be 0.48g the experimental error would be:
0.475
0.48g = 0.01 0.01/0.48 x 100= 0.2% error.
0.485
The experimental error for the top pan balance is relatively low.
-
Thermometer: This was only accurate to +/- 1°C.
The temperatures I used for my experiment were: 4, 22,27,32,37.
The errors for each temperature are as follows:
4- ¼ x 100= 25% error
22- 1/22 x 100= 4.5% error
27- 1/27 x 100= 3.7% error
32- 1/32 x 100= 3.1% error
37- 1/37 x 100= 2.7% error
-
Time: 29:01 30:01
= 0:01/30 x 100= 0.0003%
-
Measuring Cylinder: This was only accurate to +/- 1 cm3.
1/100 x 100= 1% error
For the thermometer as the temperature increased the experimental error decreased therefore I was more likely to find an error in my results at the lower temperatures.
For the measuring cylinder when the volume is small the error is large.
The total experimental error for each temperature is:
4°C- 26.2003% error
22°C- 5.7003% error
27°C- 4.9003% error
32°C- 4.3003% error
37°C- 3.9003% error
As you can see, the lower the temperature the higher the experimental error.
Improvements
- Marble chips- I could not ensure the size and mass of each marble chip, therefore could employ a sieve type mechanism.
- Range- I would spread the temperatures out more even; however have less error owing to lower temperatures.
-
Water- I would have water, which was saturated with sodium hydrogen carbonate (NaHCO3). As this allows little CO2 to dissolve in it.
Bibliography:
GCSE Chemistry Revision Guide: Co-ordination Group
Chemistry: Hunt and Sykes
Understanding Chemistry (A-level):Ted Lister and Janet Renshaw
Appendix