Re-arranging the formula gives the relationship between the specific heat capacity and temperature difference
Q = c
mΔT
This shows an inverse relationship meaning that as the temperature difference increases, the SHC for a liquid decreases.
The SHC of water is 4.1813 J g–1 K–1 or 75.327 J mol–1 K–1.
I have chosen water as my substance it is ideal because of its low viscosity, high specific heat capacity, density and abundance.
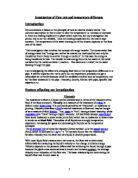
The picture above shows the cross-section of an electric shower, an electric shower involves other variables like pressure and gravity. This is the basic design I will model my experiment on.
INITIAL APPROACH
I had a choice of 2 different approaches to investigating the relationship between the flow rate and temperature difference. My first thought was to use the back of an old freezer or fridge ( the part that looks a little bit like a radiator ) and then pass the water from the top down to the bottom, this was based on the idea of solar panels. Using light bulbs placed around it to heat it. But this setup would have required an extreme amount of work due to the fact
- The radiator was really big and long so time taken to measure the temperature difference would be quite huge.
- My physics knowledge allowed me to know the fact that because the tube was metallic there would be a substantial increase in the error associated with the loss of heat to the environment because metals are good conductors of heat and electricity.
- Enormous health and safety risks because this was not a rubber tube, the tube was metal and it had a bit of rust on it and also I was working with electricity so this would mean being extremely careful due to the metallic tube.
- My setup could not easily be changed to adjust any factors because it was simply the back of an old freezer and it came like that and could not be altered without damage being done.
- There was way of keeping the temperature constant because there was no way of regulating the heat given out by the light bulb. This on its own would only have served to further complicate my experiment. It is indeed possible to calculate the energy given off because there is a power value for each lamp and time could easily be calculated. Calculating how much of this energy is given off as heat or as light would be next to impossible given the equipment available to me.
- It would have taken a lot of light bulbs to heat the water to a substantial amount.
These reasons convinced me to go with the alternate method which was simpler and less hazardous.
FINAL SETUP
For my setup I needed the following:-
- A metal container ( similar to the 1 in the above diagram )
- Rubber tubing with a device attached to it to alter the flow of water through it ( a simple clamp ).
- Clamps
- Several beakers
- Heating implement
- Thermometers
- Funnel
CHOICE OF APPARATUS
I chose to use a metal container mainly because of its better conductivity of heat. My metal container was also quite big because I know working with bigger volume reduces the effect of errors and anomalies. My tubing around the metal container was rubber this in itself is a setback of the experiment but this was ideal in this case because wrapping a metal around another would have demanded using soldering tools increasing the health and safety and also regulating the flexibility of my experiment because a rubber tube can be wrapped around a metal container with more ease it can also be moved or placed in any position and can be taken of easily when being put away. It also helps because if the tubing wasn’t rubber after the experiment, it would not have been easy to put away the equipment because the apparatus would have been really hot also increasing the energy lost to the environment creating a problem with a whole new dimension.
The clamps were also in place to help in positioning the thermometer accurately in the middle so as to enable an equal spread of the heat energy to both sides giving a fairer test. A funnel was used to ensure all the water went into the tube all these were methods of minimising the occurrence and effect of errors.
PEFORMING THE EXPERIMENT
I setup the metal container, with the rubber tubing wrapped around it, leaving both ends free, the bottom end with the flow adjuster attached to it. I kept the volume of water, and the temperature of the water in it, constant. The tricky part of my setup was keeping the rubber tubing wrapped around the metal container. I tried various methods, cello tape first of all but the adhesive property of the cello tape was lost once it came in contact with the water and it did come in contact with water often, seeing as my experiment was based around water. Finally I had to improvise and I smeared glue all around the metal container and then set the tubing around it and held it in place with a bit of glue at this point the tubing was stuck around it and then I froze it, by placing it in the freezer and leaving it for approximately 26 hours. By this time the glue was hard and dry and the tube was properly in place.
I had some water in the metal container kept at a constant temperature in this case 70 degrees. All I did was pass water through the top opening, this water was kept at a constant temperature. It then flowed around the pipe gathering energy from the metal container the water in the metal container was as previously stated at constant temperature. This water was heated by an old boiling ring which was placed in the middle of the metal container not in direct contact with the edges of the container. The same problem arose of finding a way to regulate the heat giving of by the heating implement i.e the boiling ring, I solved this by starting the experiment only when the temperature was at 70 degrees and then estimating the time it took for it to rise by a degree ( this was done roughly and mentally ). I counted roughly in my head the time taken for it to rise from 70-71 degrees. I counted 51 seconds when it was almost time for it to rise by a degree, I then simply cut the power supply to the boiling ring, then I turned it off and counted again in my head the time taken for it to drop from 71 to 70 this took longer and I counted a 1 minute and 5 seconds. So it remained at 70 for roughly a minute then I turned it back on and it started heating again and just repeated the process till I finished my experiment counting for 60 seconds each time. To make the experiment as accurate as possible I attached a funnel to the opening in the tube and then poured the water through the funnel down the tube and the water followed the spiral of the tube then flowed out of a pipe into a beaker with a thermometer in it which measured the final temperature.
HEALTH AND SAFETY
- Ensure hands are dry before going anywhere near the power switch.
- Always turn of the power before moving the heating implement.
- Ensure that the heating implement is not in direct contact with the metal container.
- Do not touch the metal container when the experiment is taking place.
- Make sure that shoes are always worn during the experiment because it hinders the conduction of electricity through the body.
- Ensure goggles and gloves are worn to prevent hot water going in the eye or burns.
My final setup looked like this –
Getting the results deemed as tricky as setting up the experiments, mainly because there was no exact way of measuring the flow rate of the water. All I had was an improvised clamp at the end of the tube, to change the flow rate. I came up with a solution to this setback. My method involved simply measuring how long it took a known quantity of water coming though at the top tube, to flow out from the end of the tube into the measuring cylinder, then I divided the specific volume (v) of water by the time taken(t) (v/t) I then varied the tightness of the clamp on the end of the tube manually, and this gave me different flow rates, calculated using the formula above, also for each reading I measured the change in temperature and managed to come up with a set of decent and accurate results,
The constant volume for my experiment was 10cm3 i.e. I measured the time taken for that volume of water to flow in and then out of tube and then divided the figure by 10 giving me the flow rate.
Tightening the clamp the first time
It took 11.66 seconds to collect 10cm3
Giving me a flow rate of 10 = 0.85610cm3/s
11.66s
The second time
It took 13.66 seconds to collect 10cm3
Giving me a flow rate of 10 = 0.73206cm3/s
13.66
The third time
It took 18.66 seconds to collect 10cm3
Giving me a flow rate of 10 = 0.536cm3/s
18.66s
The fourth time
It took 23.66 seconds to collect 10cm3
Giving me a flow rate of 10 = 0.4227cm3/s
23.66
The fifth time
It took 27.21 seconds to collect 10cm3
Giving me a flow rate of 10 = 0.368cm3/s
7.21s
The sixth time
It took me 36.55 seconds to collect 10cm3
Giving me a flow rate of 10 = 0.2736cm3/s
36.55
The seventh time
It took me 47.35 seconds to collect 10cm3
Giving me a flow rate of 10 = 0.2112cm3/s
47.35s
The eighth time
It took me 52.45 seconds to collect 10cm3
Giving me a flow rate of 10 = 0.1907cm3/s
52.45
In a table
I have decided to get 8 different flow rates. In order to guard against the risk and also the effect of an error on my investigation of the relationship between the flow rate and temperature difference.
Note
The first reading is the maximum flow rate of water for that particular tube because this is the time taken for the water to flow through with no obstruction.
I have tabulated my results below showing for each of different flow rates a temperature difference gotten by finding the difference between the final and initial temperature i.e temperature of the water being poured in at the top of the tube and temperature of the water coming out of the tube collected by the beaker –
The result for the flow rate of 0.368 is obviously an anomaly because it does not follow the general trend of the rest but instead decreases, this is most likely down to human error rather than experimental technique and upon further investigation I found out that was not the correct value for the flow rate I had gotten a flow rate of 0.368 but then left my apparatus and come back to continue not knowing that the clamp had been tampered with.
For the sake of ease and convenience this result will be ignored, leaving the results as –
There are different initial temperatures because the water was gotten straight from the tap a factor beyond my control. But in my experiment this doesn’t make a difference because I am looking at the temperature difference how much the temperature has changed. 2 readings could have different initial values and yet have the same temperature difference.
All figures where double – checked before being noted down and care was taken to avoid the use of too many significant figures.
Logic says this is a good set of results because as the flow rate decreases it means that the water flows slower in and out of the tube meaning that there is an increased time taken between water being poured in and then out. This also means that the water is in the tube and in contact with the radiation of heat energy from the metal container for a longer time. There is an increased energy transfer, if the power were to be worked out it would be constant because there is an increase in the energy transferred AND also the time taken, both these would cancel out.
The flow rate could have been improved in a variety of ways like
- Using a tube with less friction
- Pumping the water in faster, e.t.c
From the results it can be said that there is an inverse relationship (as one quantity increase, the other decreases). The flow rate is inversely proportional to the temperature difference. This could be shown mathematically by the formula
F = k
T
Key
F – flow rate of water
T – temperature difference
k – constant of proportionality
I am going to plot 2 sets of graphs, the first one showing the temperature difference on the y axis and flow rate on the x axis, this should give me a graph with a negative (decreasing) gradient and the second the temperature difference on the y axis and the inverse of the flow rate on the x axis and this should give me a graph with a straight line from origin.
I will now try and find the value of k, this is going to be done by finding the gradient of the graph and then finding the inverse of that figure. Finding the gradient of a graph is done by applying the formula y1-y2 = k
x1-x2
0.856 – 0.536 = 0.32 = 0.1793, 1 = 0.1793, k = 1
9.500 – 11.350 -1.85 k 0.1793
K = and this has the unit of cm3/s per degrees Celsius.
Sources and references
Advancing physics
http://www.focusdiy.co.uk/stry/diy19&bklist=pcat,3,advicecentrecategory,diycategory
wikepedia online encyclopedia