The method chosen depending on what experiment it is. Sometimes it is easier to measure the change in the amount of a reactant that has been used up, and sometimes it is easier to measure the change in the amount of a product that has been produced.
The word equation for the experiment is as follows:
Magnesium + Hydrochloric acid Magnesium Chloride + Hydrogen
The symbol equation for this would be:
Mg² + HCL Mg 2(HCL)
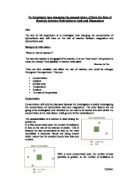
Variables
Variables that would affect the rate of reaction are:
Fixed Variable: is what will remain the same throughout the entire investigation. The temperature of the Hydrochloric Acid in this investigation is the fixed variable.
Independent Variable: is something that will be changed each time; in this investigation it will be changing the concentration.
Dependant Variable: is what will be measured each time the independent variable is changed. For this investigation, time is the dependent variable.
Prediction
I predict that as the concentration increases, the rate of reaction will increase. I think this is because there will be more particles in the solution therefore they will collide with each other more, thus a reaction will occur. I predict as the concentration increases, the rate of reaction will increase, as there are more particles colliding in the same space.
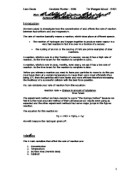
This graph represents the rate of reaction against the concentration. It shows that is has a linear trend and that the rate of reaction is proportional to the concentration of the HCl.
This graph represents time against the concentration. It shows that the lower the concentration, the longer it will take for the reaction to come to a complete stop.
Apparatus
- Magnesium strips
- Hydrochloric acid (2M)
- Ruler
- Pipette
- 250ml Beaker
- Paper Towels
- Distilled Water
- 100ml Measuring Cylinder
- Stopwatch
Fair Testing
To ensure a fair test, I will make sure that:
- My apparatus is thoroughly rinsed. This is because it will remove any particles from previous experiments. It also needs to be dried so that it doesn’t affect the dilution of the solution.
- The same total volume of each solution is used throughout the experiment.
- The chemicals will not be stirred. This is to prevent any unwanted conclusions before the stopwatch starts.
- Each experiment will be repeated three times.
- A control test will be carried out. This will check if that magnesium does react with distilled water, but on a slower scale.
Health and safety
- Safety goggles must be worn to ensure that unwanted splashes do not get into the eyes, as it could cause irritation.
- Lab coats must be worn so that it doesn’t damage clothes.
- Hands must be washed thoroughly if any acid is split onto it. This also causes irritation.
- Make sure that excess acid is not used.
Method
- Magnesium strips
- Hydrochloric acid (2M)
- Ruler
- Pipette
- 250ml Beaker
- Paper Towels
- Distilled Water
- 100ml Measuring Cylinder
- Stopwatch
- Measure HCL in measuring cylinder. Start with 10ml of it.
- Add 90ml of distilled water, so it makes the solution 100ml
- Pour it into a 150ml beaker
- Cut many magnesium strips to measuring at 2cm, so they are equal size.
- Label the beakers 0M, 0.4M, 0.8M , 1.2M , 1.6M , 2M
- Drop the magnesium strip into the 150ml beaker vertically.
- Start the stopwatch as soon as the magnesium hits the hydrochloric acid
- Stop timer when the reaction finishes.
- Record timed results.
- Rinse out the beaker and dry it with paper towels.
- Repeat the experiment but use 20ml of HCl and 80ml of distilled water.
Preliminary experiment
Before conducting an experiment an initial concentration table was made. The concentration table as shown below shows how much of HCl and water was needed.
The initial plan of the investigation was to use 100ml of solution; however the total volume of the solution has been changed to 50ml. This has been changed as when the preliminary test was carried out, 10ml of HCl and 90ml of distilled water took too long. The experiment was stopped after 21minutes 30seconds, due to time issues.
As the first experiment took so long I was unable to conduct a more detailed preliminary test. But this has helped as I now know not to use the original concentration table. It also came to my attention that I would be wasting twice the amount of Hydrochloric acid if 100ml solution were to be used. The new concentrations are as following:
Results table
Graph on next page
Analysis
The graph shows that the higher the concentration the faster the reaction. The graph was an average of the three results taken. The concentrations 1.2, 1.6M, 2M took less than a minute to react. This shows that the higher the concentration the quicker the reaction. The preliminary work helped to make this experiment successful as it was discovered that 100ml was too much and the initial concentrations that were going to be used would not have worked as well as the final concentrations used. I had a few anomalies. This might have been because the experiment was taken from the highest concentration to the lowest concentration. This was an error as when the hydrochloric acid was being measured it had to be rinsed again and again, which meant that the water particles stuck to the inside of the measuring cylinder. Any anomalies like this could be avoided if dry measuring cylinders were used, however lack of equipment would not let this happen.
Conclusion
My prediction was, “as the concentration increases, the rate of reaction will increase.” By observing the average times against the concentration in the graph, I can see that the higher the concentration the quicker the reaction, thus making my prediction correct. I also can conclude that the lower the concentration, the more time it will take.
The second graph is a rate over concentration graph. This graph shows how the higher the concentration, the quicker the time took. A graph was drawn as shown below which when compared to the actual graph with the average results, it looks very similar. This shows that there is some sort of correlation between my prediction and my results, which I can therefore conclude that my experiment was a success.
Evaluation
The qualities of the results taken were not as accurate as I would have predicted. I believe that this was the case as when the experiment was carried out the experiment was carried from a high concentration to a low concentration. This therefore meant that the measuring cylinder was not perfectly clean, which means that it would have left residue from the previous experiment. This would have affected the results in such a way that it might not have been too concentrated. However, this is only an observation as I cannot comment on this error affecting the entire set of results. A way to avoid this could have been to use new measuring cylinders or to rinse out the measuring cylinders. The con in this is that there isn’t a lot of equipment to be wasted, and in addition rinsing the measuring cylinder would have made it less concentrated. These faults could explain the anomalous results I had. The results were only slightly anomalous, and in this experiment could be used as the investigation does not need to go into thorough detail, and the results helped justify the prediction and conclusion.
To improve the investigation, accurate measuring cylinders would be used, and an accurate method of measuring the time taken to react would be found. A greater range of readings could be recorded and put into a graph. Another thought of furthering the investigation could be to investigate other variables/factors, such as varying the temperature, or increasing the surface area of the magnesium ribbon. To determine the reliability of the results, other ways of editing the investigation could be considered. They could be to stir the beaker with a glass rod – this helps initiate the reaction.