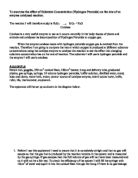
The equation used to show this reaction is shown below:
Apparatus:
- Measuring cylinder
- Cork borer
- Pestle and mortar
- Tweezers
- Stopwatch
- Potato
- Scalpel
- Ruler
- Filter paper discs
- Safety goggles
Method:
- Measure out the hydrogen peroxide and water to the molarity 0.4.
- Using a cork borer of size 6, extract a potato strip of 5cm from the centre of the potato and cut into small pieces using a scalpel. Next, ground these pieces using a pestle and mortar to create a paste.
- Next, soak a small disc of filter paper in the solution.
- Place the paper into the cylinder with tweezers and use a stopwatch to time how long it takes for the disc to sink in the cylinder and return to the surface.
- Record the time and repeat three times.
- Change the molarity in the cylinder to 2 and repeat the steps.
Pilot Run:
To decide which size of cork borer to use and what size strip of potato, I will conduct a pilot run. I will use the two molarity extremes to check that the sizes will work with all the molarities.
Results:
Conclusion:
From the results, I can see it will be fine to use cork borer size 6 and 5cm of potato in the actual experiment because if it worked for the two extreme molarities and gave me decent results, it will be fine for all the other molarities in between.
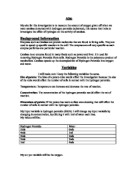
Actual method:
Because I will be using all the molarities in my actual experiment rather than just the extremes, after each separate molarity experiment has been carried out, and repeated 3 times, I will need to change the substrate concentration using the table below.
Molarity Table:
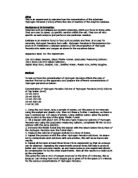
Prediction:
I think that if you increase the substrate concentration, the product (oxygen) will double too. I predict that as the molarity of the substrate goes up, the length of time it takes the disc of filter paper to sink and return to the surface will get shorter and shorter. This is because the higher the concentration of substrate, the quicker the reaction will be. This means that the oxygen from the reaction is produced quicker. The oxygen causes the filter paper disc to rise to the surface of the tube and therefore the filter disc will return to the surface quicker.
The graph below shows that if the substrate is doubled, the product doubles too. It also shows that when the substrate concentration reaches a certain point, some of the substrate is left unused and it causes the reaction to remain at its best, shown on the graph by the plateau.
Fair test:
To ensure a fair test, I will make sure I only change one variable at a time. This means I will have to be careful of things such as temperature of the water or hydrogen peroxide and the quantities of water, hydrogen peroxide and potato I am using.
Safety:
Because the hydrogen peroxide is toxic, safety goggles must be worn and if the chemical touches any skin or gets into eyes, they must be rinsed immediately.
Actual results for experiment:
Time for filter disc to return to surface
Conclusion:
My results show that the higher concentration that the substrate is, the less time it takes for the filter paper disc to return to the surface of the hydrogen peroxide. This means that the higher the concentration, the more product (oxygen) is produced. This and my graph show what I said would happen in my prediction. Looking at the two extremes can prove this. In the experiment with the molarity 0.4, the disc took an average of 17.3 seconds to sink and return to the surface, which was clearly the longest. The experiment with the molarity 2, was the quickest as the disc only took an average of 4.63 seconds to sink and return to the surface. This means that the experiment using molarity 0.4 had a much lower reaction rate at 5.78 per second compared to the experiment with molarity 2 which had a reaction rate of 21.7 per second. This means hat if you increase the substrate concentration, more active sites can be used and therefore more product is produced. The product in this experiment was oxygen so the more that was produced, the quicker the filter paper disc was to return to the surface of the hydrogen peroxide.
Results and Anomalous Data:
I think my results are quite reliable because the three different results from each separate concentration were quite similar. All the results were quite symmetrically spaced out on the rate graph. I think the result for the experiment using 0.8 molarity may have been not as good as it could have been as it doesn’t really fit in with the line of best fit. The time should have been faster. This could have been because of a number of reasons. The disc may not have been thoroughly soaked in the potato juice or there could have been an error in measuring out the concentration of the hydrogen peroxide. As it was only one result, I feel my results are of a good quality.
Improvements:
To improve the method I could have timed how long I soaked the filter paper disc in the potato juice for to ensure that all the discs soaked up the same amount of enzyme. To make the test fairer, I could also have changed the hydrogen peroxide after each repeat to ensure the hydrogen peroxide concentration was pure and clean.
Further Work:
Another experiment I could do to measure the rate that different concentrations of catalase break down hydrogen peroxide, would be in an inverted measuring cylinder, to measure the oxygen produced by the displacement of water. I would mix the enzyme and substrate together in a test tube and then use a tube to collect the gas given off and send it to a measuring cylinder and it would be measured at regular times for a total duration of a minute.
For this experiment, I would expect the amount of oxygen produced in the minute to increase as the concentration of the catalase increased, this is because as the catalase concentration increases, the rate of reaction also increases.