- Finally, to work towards my aim, I will then change the length of my wire 9 more times between the lengths of 10cm and 100cm (increasing the length by 10cm each time). This will give me 10 readings and therefore, allowing me to create an accurate graph of results.
- I will repeat these steps again for a second time to make sure my results are reliable.
Fair Test:
To make my investigation a fair test, I am going to keep some variables the same. I will keep the material of wire the same throughout, as different resistance wires have different properties i.e. one wire may be more resistant than another, consequently disrupting the fairness of the test. I am also going to keep the diameter of the wire the same all the way across the wire and throughout the investigation. This is because, it will affect the resistance of the wire (the larger the diameter of the wire, the larger the resistance).
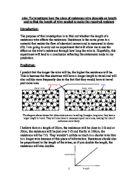
The diagram above shows that in the wire with the thicker diameter, it is more crowded and there are more ions that are also more compact to each other; hence making collisions more likely and increasing the time taken for the electrons to complete the circuit. NOTE: Both diagrams have an equal length but the one on the right has a larger diameter. (This diagram utilises the same key as the first diagram in this piece of coursework i.e. the small, black circles are electrons and the larger, white circles represent ions.)
To make sure the diameter of the wire is the same throughout; I am going to use a micrometer to test that this is true.
I don’t have to keep the temperature the same the whole time, even though it can affect the resistance. This is because the resistance of the constantan material stays fairly constant when the temperature increases. Even at high temperatures - 200°C – the resistance only differs by about 0.5%
Accuracy:
To make sure I will measure the length of wire accurately, I will read the length from a bird’s eye point of view, making it more accurate. The wire will also have been stretched out prior to taking the readings and will be stretched to the millimetre, as my ruler will have markings for millimetre advancements as well. I will also look carefully and not just write down the first thing that I think I see.
To make sure I will measure the current and voltage accurately, I will record the readings from a bird’s eye point of view as well for the same reason as for when I will be reading the length of the wire. Additionally, I will make sure that I don’t make a large human error while reading the scales. This will be done by using an ammeter of 0A-1A scale with 0.02 divisions and a voltmeter of a 0V-6V scale with 0.2 scale divisions. This will reduce the chance of me getting less accurate results due to the fact the results will read more accurately from a lower scale division. One more way of increasing accuracy through human errors includes notifying whether the ammeter/voltmeter has a reading of 0A/V before I start, which is to make sure I don’t make the zero error.
Reliability:
To make sure my readings of current and voltage are reliable, I will repeat the experiment. If the readings from the second time of doing my experiment are similar to those from the first time, then I will know that they are reliable. If they are not, then I will repeat my experiment again to ensure that my results will be reliable.
To certify the right range of lengths for a good set of results for resistance, I will carry out a preliminary experiment, where I will note down which lengths will give me sensible readings.
I will use 10 different lengths of wire to get readings, going up by 10cm each time starting from 10cm and ending at 100cm. This will ensure that my graph is more reliable and if there are any anomalous points, it will be easy to see.
Safety:
For safety reasons, I will not touch the wire while a current/voltage is flowing through it, as it is dangerous and the wire will also be very hot. Another thing I will do to be safe, is to make certain that everything is connected properly before turning the power supply on. I will also make sure that nothing is obstructing the investigational area, as it may be dangerous.
Preliminary Work:
In my preliminary work, I tested different lengths to see which range of lengths will suit me best to achieve the most useful set of results. I found out that if I started at a length of 10cm with a voltage out of 4V, the wire would become too hot and the ammeter would show a current of over 1A. Then, I changed the voltage out to 2V and the same result occurred. This meant that I will not use this reading when I am drawing my graph. I began to go up by 10cm each time and this provided some sensible results, which is why I decided to use this length gap in my experiment. I also found that nearly all of my results came to a reading that was between 0A-1A. This made me decide that I am going to use an ammeter with the same scale to make my readings more accurate. Finally, I measured the diameter of my wire in 3 different positions, which gave me results of 0.315mm, 0.31mm and 0.31mm. These results meant that the diameter of my wire was roughly the same all the way across.
Results:
On the previous page is my results table with both sets of my results on there. I will now draw a graph from these results, using only the values for length and average resistance.
Graph (excel and hand-written one):
Analysing Evidence:
My graph backs up my prediction, as I said that as the length will increase, the resistance will also increase proportionally. It does this through the shape of the line of best fit, which increases in resistance and in length proportionally (when the length of the line increases - y value - so does the resistance - x value). This is because the electrons will have to travel further through the wire, and therefore making collisions with ions more likely.
I can use my graph to find out the length needed to make a 5, 10 and 15 ohm resistor:
5Ω resistor=75cm
10Ω resistor=150cm
15Ω resistor=225cm
I found these out by using my line of best fit. I found out the length needed for a 5 Ω resistor and then doubled it to get the length for a 10Ω resistor and multiplied it by 3 to get the length for a 15Ω resistor.
I believe I have used a sufficient range of lengths to justify the relationship between length and resistance. My graph shows enough readings to show the relationship clearly and to create a line of best fit.
Evaluation:
To evaluate, the readings for my current, voltage and length measurements looks pretty reliable, as my average resistance results turned out to be as predicted, which means that there probably wasn’t any mistakes in measuring. I am going to prove that the readings for my current, voltage and length measurements are accurate by finding out my percentage error;
current: (0.01/0.47)100 = 2.127659574 = 2.13% (2 d.p.)
voltage: (0.1/3.2)100 = 3.125%
length: (0.5/10)100 = 5%
The above calculations show that my percentage error is very low and this means that I have a very accurate set of results for current, voltage and length. The numbers in blue indicate half a scale division, whereas the numbers in red represent my lowest reading. The number in green (0.5cm for my length) stands for how much I believe my wire was out of position by.
To make the measurements above accurate, I concentrated on using a bird’s eye point of view in my procedure (method) to measure them, as that is the view which gives the best accuracy. I also checked to make sure the measurements were correct twice and used a smaller scaled ammeter and voltmeter to gain more accuracy.
I have one or two slightly anomalous results, as shown on my graph (the points for 30cm and 40cm, which sort of stick out a little from the trend line – or line of best fit). I believe this result may have been caused by the length of the wire not being correctly set or a misjudgement in my calculations. I also had one result from my table, for 20cm on my second time round doing the experiment, where I worked out a result for resistance that was dissimilar to the result I got while doing the experiment for the first time. This may have been caused again by a little misjudgement, a miscalculation or the wire not being correctly placed. To prevent one of these mistakes from occurring, an improvement may be to straighten the wire more by increasing the tension in the wire, which will make it straighter.
I believe my procedure could be improved by including a variable resistor, which would allow me to roughly control the temperature emitted from the experiment, hence stopping heat from affecting the experiment (even if it only affects it a little due to the presence of the constantan wire). I also feel the accuracy and reliability of my results can still be improved. I believe that I may have rushed through collecting the results a little and should have taken more time, hence improving these two factors. I also think that the accuracy could be improved by using digital ammeters/voltmeters, which would give more accurate readings.
This same experiment could also be carried out using a different method; instead of using an ammeter and a voltmeter, an ohmmeter could be used, which would drastically improve the accuracy of my results even more. This is because I wouldn’t have any chances of making any human errors while reading the meters or while calculating the resistance.
The diameter of my wire was roughly the same at all positions. I know this because I used a micrometer to measure the diameter of my wire at 3 positions and the readings I got were, 0.315mm, 0.31mm and 0.31mm This meant that my test would be fair because if the wire was maybe thicker, then the resistance would be less due to the fact that the electrons will have a greater diameter in which to not collide with the ions.
Conclusion:
To conclude, I have proved that the longer the length of a resistance wire is, the larger the resistance is. I have done this using a wide array of equipment, my own knowledge and the formula for working out resistance. To show that I have proven this statement, I have drawn a graph that clearly shows this through the line of best fit.