Method:
- We set the ohmeter to 200 Ω. We then connected two wires one in each of the ac terminals. Onto the end of these wires we connected two crocodile clips one to each. We measured the resistance of the wire and the crocodile clips by touching the ends together.
- We connected one of the crocodile clips to the very start of the wire. We then moved the second crocodile clip down the wire at 10-centimeter intervals. We took two readings at each interval.
- We measured the diameter of each wire using a micrometer.
- We recorded our results.
Safety: this is not a very dangerous experiment but despite this you must always handle electricity with care, keep the current low, handle with dry hands etc
Results:
Area of wire:
Area of each thickness:
We recorded the three different wires’ diameters using a micrometer.
Thick =0.55mm
Medium=0.35mm
Thin=0.22mm
To get the area of the cross section we used the equation
The areas of the cross-sections were;
Thick= 0.2375mm
Medium= 0.096mm
Thin= 0.038mm
To then get the total area we multiplied the cross section of the wire by its length.
Total areas
Numbers in bold and Italics equal volumes in mm³
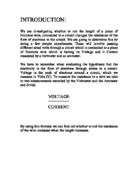
Analysis:
Graph one clearly shows that the thinner the wire the lower the resistance. The thickest wire gives the lowest output in a given time, whereas the thinnest wire gives out the greatest output in a given time.
My prediction is correct, because I said the thinner the wire the higher the resistance. This is proven in my results. For example at 100cm the thickest wire’s resistance was 4.85 ,whereas at the same length on the thinnest wire the resistance was 26.2 .
My prediction is also true in that I said the longer the wire the higher the resistance. If you look at the medium (0.096mm ) the resistance rose by 1 at each 10 cm interval.
Evaluation
I feel that overall our results were quite accurate. This is can be seen when we look at the graph, which shows a straight line with all of the points being very close to or on that line. :
If we did get anomaly they were still very close to the line of best fit. The reason for these anomalies could have been due to a number of different factors. Firstly the temperature of the wire was not necessarily 20ºC when we conducted the experiment and the material of wire may not be as pure as it should have been. The main reason for this was probably due to the equipment that we used being inaccurate. This did not stop us from seeing the trend, though, because the equipment would have been out by a constant amount each time therefore there was a constant error. So the trends that were predicted in the plan still were shown.
Most errors in our experiment were encountered in the measuring of the wire. This is because it simply was not very practical to hold a piece of wire straight, whilst holding it next to a ruler and then trying to accurately fix crocodile clips to the right part on the wire. Also I do not feel that the crocodile clips were always fixed securely to the wire with a good connection. This also meant that they were easy to move about on the wire changing the length of it. Errors rarely occurred in the setting of the current and the reading of the voltage. It was just in the preparation area that they did occur. Another example of this is the wire was never totally straight when we started the experiment, which may also, as said earlier on, effect the resistance of it.
I do not think that doing any more results in our experiment would have made it any more accurate. I feel that the only way to make it more accurate would be to use a different method – perhaps were we had a bar that did not bend in place of the wire. We could even use a rheostat in place of the wire, because it is essentially a long coiled wire that is connected at different lengths to change the resistance of the circuit