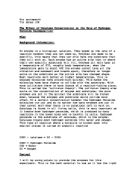
Figure 2. Hypothesized graph showing rate of reaction with respect to enzyme concentration
Apparatus/Materials
1 Notebook with Logger Pro software installed or thumbdrive
1 Vernier Labquest
1 Vernier gas pressure sensor
1 1-hole rubber stopper assembly
2 10ml measuring cylinder (±0.1cm3)
2 100ml beaker
1 blade
1cork borer of 8mm diameter (±1mm)
1 ruler(±0.3mm)
1 laboratory thermometer (±0.5°C)
1 boiling tube rack
8 boiling tubes
2 potatoes
3% Hydrogen Peroxide
1 white tile
1 glass rod to push out the potato from the cock borer
Variables
Table 1. Independent, dependent and controlled variables used in the experiment to find out the effect of catalase concentration on rate of decomposition of hydrogen peroxide.
Methodology: To Test the Effect of Enzyme Concentration (done in pairs)
Prepare the computer for data collection. Set the sample rate to 23 samples per minute.
Connect the plastic tubing to the valve on the Gas Pressure Sensor.
Place four test tubes in a rack and label them 1 ,2, 3 and 4.
Using a 10ml measuring cylinder, measure 10ml of 3% H202 to each test tube.
Place a potato on a white tile and using a cork borer (8mm diameter), push it through the potato to obtain a cylinder of the potato.
Cut the cylinder of potato into pieces of 2mm thick using a ruler and a blade.
Vary the concentration of catalase by varying the number of pieces of potato used. 2, 4, 6, 8 potato discs were used for each test tube respectively to obtain four different concentrations.
Place the pieces of potato in the H202 solution. This step is done in two seconds.
Connect the free-end of the plastic tubing to the connector in the rubber stopper. This is done in two seconds. Click collect data to begin data collection. Data collection will end after three minutes. While data collection is taking place, gently swirl the test tube continuously for three minutes to thoroughly mix the contents.
If the pressure exceeds 130kPa, the pressure inside the tube will be too great and the rubber stopper is likely to pop off. Disconnect the plastic tubing from the Gas Pressure Sensor if the pressure exceeds 130kPa.
When data collection has finished, disconnect the plastic tubing connector from the rubber stopper. Remove the rubber stopper from the test tube.
Each pair of students may work on two different concentrations of catalase. Students may then exchange results to obtain four different concentrations of catalase and five different replicates for each concentration.
If results are exchanged, students must take note of the controlled variables that must be kept consistent for both groups.
Control experimental set up for each concentration of catalase would be using boiled catalase.
Measure the temperature of the H202 solution to make sure the temperature is kept constant. This is to ensure that temperature is not affecting the rate of reaction.
Raw Data
Table 2.1 5 replicates of Experimental Data collected from the Vernier data logger with a Gas Pressure Sensor for experiment carried out using 2 potato discs. 15 second intervals are used for each set of data.
Table 2.2 5 replicates of Experimental Data collected from the Vernier data logger with a Gas Pressure Sensor for experiment carried out using 4 potato discs. 15 second intervals are used for each set of data.
Table 2.3 5 replicates of Experimental Data collected from the Vernier data logger with a Gas Pressure Sensor for experiment carried out using 6 potato discs. 15 second intervals are used for each set of data.
Table 2.1 5 replicates of Experimental Data collected from the Vernier data logger with a Gas Pressure Sensor for experiment carried out using 8 potato discs. 15 second intervals are used for each set of data.
Effervescence in the test tube was observed a few seconds after the potato discs were placed inside the test tube containing hydrogen peroxide solution. This shows that the catalase present in potato discs are decomposing the hydrogen peroxide solution.
Formulas
Mean:
For example, to find the mean of the air pressure for the experiment using 8 potato discs for time 0s
Mean air pressure =
=103.28 (2d.p)
Standard Deviation:
S= Standard Deviation
N = the amount of Values
χi =the value
= Arithmetic Mean
For example, to find the standard deviation of the air pressure for the experiment using 8 potato discs for time 0s
Standard deviation
=
= 1.31 (2d.p)
Rate:
Rate of reaction=
P1= Initial value (in this case it is the intial product)
P2= Final value (in this case it is the final product)
For example, to find the rate of decomposition of hydrogen peroxide when 2potato discs are used
Rate of decomposition =
= 0.523/min (3d.p)
Processed Data
Table 3. Processed Data of mean air pressure and standard deviation of the five replicates using the four different concentrations of catalase obtained from using 2 potato discs, 4 potato discs, 6 potato discs and 8 potato discs respectively. 15 second intervals are used for each set of data.
Graph 1.1 Mean air pressure with respect to time of the five replicates when 2 potato discs are used with their respective catalase concentration. Error bar obtained from standard deviation values indicate uncertainty of results obtained.
Graph 1.2 Mean air pressure with respect to time of the five replicates when 4 potato discs are used with their respective catalase concentration. Error bar obtained from standard deviation values indicate uncertainty of results obtained.
Graph 1.3 Mean air pressure with respect to time of the five replicates when 6 potato discs are used with their respective catalase concentration. Error bar obtained from standard deviation values indicate uncertainty of results obtained.
Graph 1.2 Mean air pressure with respect to time of the five replicates when 8 potato discs are used with their respective catalase concentration. Error bar obtained from standard deviation values indicate uncertainty of results obtained.
Graph 2. Mean air pressure produced in the experiment with respect to time of the five replicates using the four different catalase concentrations obtained from using 2 potato discs, 4 potato discs, 6 potato discs and 8 potato discs respectively. Graph does not include error bar for easier viewing and there is a ±1 standard deviation of the 5 replicates and anomaly in data points.
Table 4. Rate of decomposition of hydrogen peroxide obtained from the five replicates of the experiment using four different catalase concentrations by using 2 potato discs, 4 potato discs, 6 potato discs and 8 potato discs respectively.
1: Rate of reaction was kept to 3 decimal places rather than 2 decimal places for increased accuracy to show how rate of reaction varies when catalase concentration varies.
Graph 3. Rate of decomposition of hydrogen peroxide obtained from the five replicates of the experiment with respect to changes in the number of potato discs. There is a ±1 standard deviation of the 5 replicates and anomaly in data points.
Conclusion
From graph 3, it is shown that as the number of potato discs increases, the rate of decomposition of hydrogen peroxide increases. As catalase is found in potato tissue, when the number of potato discs placed in the test tube increase, the concentration of enzyme catalase in hydrogen peroxide solution also increases. Thus the results show that an increase in enzyme catalase concentration causes the rate of decomposition of hydrogen peroxide to increase, assuming all other factors such as the pH, temperature and concentration of hydrogen peroxide solution remains the same. Thus, the first part of the hypothesis is proven to be true.
However, graph 3 has a concave up instead of a concave down, thus proving the hypothesis wrong that the rate of reaction will increase at a slower rate. Rather, graph 3 shows that as the number of potato discs increases causing the concentration of catalase to increase, the rate of decomposition of hydrogen peroxide increases at a faster rate. This could be due to a random or systemic error in the experiment carried out or the presence of other factors that were not controlled in the experiment such as the pH of the hydrogen peroxide solution. As the pH of the solution was not monitored, there might have been an increase or decrease in the pH of the solution to the optimum pH (approximately 7) of the enzyme catalase during the experiment, thus causing the rate of decomposition to increase at a faster rate.
In addition, the gradient of graph 3 when 8 potato discs are used is large, thus showing that the concentration of catalase is not yet a limiting factor of the reaction when 8 potato discs are used. The graph shows that the rate of decomposition of hydrogen peroxide will continue to increase as the number of potato discs used increases after 8 potato discs are used. Thus, graph 3 does not look similar to the hypothesized graph as graph 3 only shows the relationship between the concentration of catalase and the rate of decomposition of hydrogen peroxide when the concentration of catalase is still a limiting factor of the reaction. The active sites of the enzyme catalase are completely saturated so the rate of decomposition will continue to increase as enzyme catalase concentration increases.
Evaluation
As a result of systemic and random errors, the results of the experiment showed some anomaly.
Firstly, although the delays between the time the pieces of potato discs were placed into the test tube, when the plastic tubing was attached to the rubber stopper and when the stop watch was started was standardized to 2 seconds between each action, due to human reaction time error, some of the individual experiments using different numbers of potato discs might have lost more oxygen produced to the surrounding environment than others. Thus, the results of each experiment using different numbers of potato discs will be affected in relation to each other, though it should not make any negotiable differences to the overall results.
Secondly, there is random uncertainty present in the thickness of the potato discs due to human limitations. While the student can reduce parallax error by cutting the potato discs perpendicular to the surface at which the potato discs are being cut, it is not possible to be entirely exact in the measurement due to limitations in the ruler and the skills of the student conducting the experiment. To improve on this, an instrument of lower tolerance can be used instead and the weight of each potato disc can be measured to ensure that they contain the same number of plant cells and hence a relatively same amount of catalase. However, this limitation can never be totally gotten rid of.
Thirdly, although there was an attempt to standardize the diameter and thickness of the potato discs to 8mm in diameter and 2mm in thickness, the amount of catalase present in each potato discs cannot be measured and thus, although the sizes of the potato discs are the same, they may contain different amounts of catalase as they come from different parts of the potato. Thus, it is not accurate to say that the number of potato discs placed into the test tube is proportional to the concentration of catalase used in the experiment. To improve on this, instead of using potato discs as a source of enzyme catalase, yeast can be used as a catalase substitute as the concentration of catalase present in yeast can be weighed and measured.
Finally, although there was an attempt to standardize the volume of hydrogen peroxide used in each experiment, random error might have occurred due to parallax error when reading off the meniscus of the measuring cylinder when measuring out 10ml of hydrogen peroxide. The volume of hydrogen peroxide solution might have been read above or below the meniscus, resulting in the amount of hydrogen peroxide molecules to vary from experiment to experiment. The concentration of hydrogen peroxide molecules would thus be affecting the rate of decomposition as well, masking the overall results. In order to see the meniscus more clearly, a piece of paper with a red marking on it could be held up behind the measuring cylinder until the reflection of the red marking is visible on the outline of the meniscus. This method allows greater ease in reading the measurement.
Bibliography
http://faculty.clintoncc.suny.edu/faculty/michael.gregory/files/bio%20101/bio%20101%20laboratory/enzymes/enzymes.htm [Last Accessed 10 April 2012]
2. http://en.wikipedia.org/wiki/Catalase [Last Accessed 10 April 2012]
3. http://www.slideshare.net/wkkok1957/ib-biology-on-decomposition-of-hydrogen-peroxide-by-enzyme-catalase [Last Accessed 10 April 2012]
4. http://www.catalysis-ed.org.uk/principles/enzymes.htm [Last Accessed 10 April 2012]
http://www.slideshare.net/wkkok1957/ib-biology-on-decomposition-of-hydrogen-peroxide-by-enzyme-catalase [Last Accessed 10 April 2012]
http://www.catalysis-ed.org.uk/principles/enzymes.htm [Last Accessed 10 April 2012]
http://en.wikipedia.org/wiki/Catalase [Last Accessed 10 April 2012]
http://faculty.clintoncc.suny.edu/faculty/michael.gregory/files/bio%20101/bio%20101%20laboratory/enzymes/enzymes.htm [Last Accessed 10 April 2012]