To investigate the factors that affect the rate of reaction between calcium carbonate (marble chips) and hydrochloric acid
To investigate the factors that affect the rate of reaction between calcium carbonate (marble chips) and hydrochloric acid
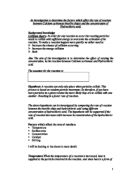
Planning
Background information
In this experiment, the two reactants are calcium carbonate, CaCO3, a solid at room temperature, and hydrochloric acid, HCl, an aqueous solution. The following reaction occurs between them:
CaCO3 (s) + 2HCl (aq) CaCl2 (aq) + H2O (l) + CO2 (g)
A reaction occurs when particles collide. If the particles do not collide or do not collide with sufficient force, no reaction occurs.
The rate of reaction is a measure of how fast a reaction takes place. It depends on how quickly and with how much force the particles collide. As the collisions increase in number, force, or both, the rate increases and the reaction occurs more quickly.
After years of extensive experimenting, scientists have found that the rate of reaction depends on four factors, and that the rate increases when:
. The temperature of the reaction is increased.
An increasing temperature means that particles have more energy and so move at a faster rate and with greater force - increasing both the frequency and the force of collisions, and therefore increases the frequency of collisions where the particles have sufficient activation energy to break the initial bonds.
2. The concentration of a reactant in the solution is increased, or the pressure of a gas is increased.
There are more particles of a reactant, and so collisions are more frequent. Gas particles are more closely packed together with a higher pressure, and so this increases the collision rate.
3. The surface area of a solid reactant is increased.
By breaking up a solid reactant, the surface area increases and so more particles are available for useful collisions.
4. A specific catalyst is added, or in living cells, the production of enzymes.
Catalysts and enzymes give reacting particles a surface that they can attach to in order to increase the number of collisions.
After studying this information, I have decided to investigate the effect of changing temperature on the rate of reaction.
I decided that the other variables were less suitable for the experiment because:
* The concentration of the solution would change constantly, and the temperature would have to be kept constant which could be difficult.
* It would be impossible to measure accurately the surface area of calcium carbonate or hydrochloric acid, and so would produce inaccurate results. The surface area would also change throughout the reaction.
* I was not aware of any suitable catalysts for this reaction.
* The temperature is easy to measure and change using simple apparatus, and to a high degree of accuracy, keeping all other variables constant easily.
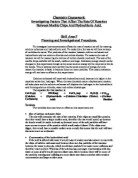
Prediction
I predict that with an increase in temperature, the rate at which the reaction occurs will increase. From my textbook, I found that the speed of reaction is inversely proportional to the time taken for the reaction to finish, i.e.
Rate of reaction ?
I predict that with every 10?C increase in temperature, the rate of reaction will double. As the particles gain more energy with increasing heat, they will move faster, and they will have more energy when they do collide. Therefore the likeliness of a reaction between two particles with sufficient activation energy has doubled.
Planning Experiment
I will exploit the fact that as the reaction occurs, CO2 is released into the atmosphere by measuring how long it takes for a fixed quantity to be produced. Temperature will be the only variable ...
This is a preview of the whole essay
Rate of reaction ?
I predict that with every 10?C increase in temperature, the rate of reaction will double. As the particles gain more energy with increasing heat, they will move faster, and they will have more energy when they do collide. Therefore the likeliness of a reaction between two particles with sufficient activation energy has doubled.
Planning Experiment
I will exploit the fact that as the reaction occurs, CO2 is released into the atmosphere by measuring how long it takes for a fixed quantity to be produced. Temperature will be the only variable I will change; the other variables will be kept constant.
Working
From the balanced equation at the beginning,
mol of CaCO3 is needed to react with 2 mol of HCl.
Therefore the amount of CaCO3 needed to react with 25cm3 of HCl is:
No of moles HCl = concentration x volume
= 2 moldm-3 x 0.025 dm3 = 0.05 mol
? 0.025 mol of CaCO3 is needed
Mass of CaCO3 = relative formula mass x no of moles
=(40 + 12 + (16 x 3)) x 0.025 mol
= 2.5g
Apparatus List
Calcium Carbonate (Marble Chips)
Dilute Hydrochloric Acid (2 moldm-3)
Conical Flask with Tube Addition
00 cm3 Measuring Cylinder
25cm3 Measuring Cylinder
Electronic Balance
Timer
Bunsen Burner
Gauze
Tripod
Thermometer (0-100?C)
Stand, Boss and Clamp
Diagram
Method
. 25cm3 of HCl was placed in the conical flask with the tube addition, as shown in the diagram below.
2. The temperature of the acid was recorded.
3. 3g of small marble chips, CaCO3 was added, and the bung placed in the neck of the flask.
4. Bubbles started to fill the measuring cylinder, and the timer was started immediately.
5. The timer was stopped once the gas produced reached the 100cm3 mark.
6. The temperature of the solution was recorded immediately afterwards.
7. Steps 1-6 were now repeated, but after Step 1, the HCl was heated using a Bunsen Burner to the following temperatures:
a. 30?C
b. 40?C
c. 50?C
d. 60?C
e. 70?C
f. 80?C
This array of measurements covers a large range and so will give a more accurate graph; if only a small range was used the graph could be misleading.
Any temperature above 100?C would require a different, larger thermometer and so the readings would be less accurate, and from 85?C upwards, the water in the hydrochloric acid would start to evaporate, and a lot of heat would be lost in a short amount of time. Any temperature below room temperature, 20?C, would require the solution to be cooled.
The temperature is measured before and after the 3-minute period as heat loss will have affected the temperature, and an average will be taken of the two in order to gain a reliable result.
It is very important to keep the other variables constant throughout the experiment, and to only change the temperature. Therefore the amounts of CaCO3 and HCl will be kept constant, and the surface area of the CaCO3 kept as constant as possible by using the same size marble chips. HCl of concentration 2moldm-3 will be used throughout.
Safety
From the Hazard Cards in the laboratory, I found the following instructions:
Hydrochloric Acid
Corrosive - may cause burns
Vapour is irritating to respiratory system
Solutions ? 6.5M = corrosive
2 - 6.5M = irritant
Calcium Chloride
Irritating to eyes, respiratory system and skin
Calcium Carbonate
Harmless
However, the quantities involved in the experiment are very small, and the molarity of the Hydrochloric Acid is at the bottom of the irritant grouping, so is slightly irritant.
? But safety goggles must be worn at all times, and contact with skin and eyes avoided.
If contact etc. does occur, there are further instructions on the Hazard Cards.
Preliminary Experiment
Table of Results - Preliminary Results
Initial Temperature of HCl (?C)
Final Temperature of HCl (?C)
Average Temperature of HCl (?C)
Time Taken (secs) to produce 100 cm3 of CO2
20.5
20.0
20.0
49
33.0
31.5
32.5
28
40.5
38.0
41.5
20
52.5
49.0
51.0
3
61.5
58.5
60.0
9
74.5
70.5
72.5
7
80.0
71.0
75.5
7
Graph of Preliminary Results
See next Page
Analysis of Results
There was no need to change the range of variables, as the fastest reaction time (with a high temperature), was not too short, and the slowest reaction time (with a low temperature), was not too long either.
One change that will have to be made is that in the preliminary method, the time taken to produce 0-100 cm3 of CO2 was recorded, but it was difficult to start the timer to exactly coincide with the very beginning of the production of gas, and so 10-100 cm3 will be recorded instead. Therefore 90 cm3 of gas will be produced, not 100 cm3.
I found this preliminary experiment satisfactory although the measurements are not extremely accurate due to the problem of 0-100 cm3, but the results produced are consistent - i.e. as the temperature increases, the time taken decreases, and the points on the graph are close to the line of best fit. The experiment was simple to do, and the amendments and improvements that will be made will help the final experiment become more accurate, and more efficient.
Obtaining Evidence
Method
The final method and diagram used in the preliminary method were used, with the exception of measuring 10 - 100 cm3 of gas. Therefore Step 4 will read:
4. Bubbles started to fill the measuring cylinder, and the timer was started once the gas reached the 10 cm3 mark.
A repetition of the experiment was made, and an average of the two experiments was taken to provide a more accurate final result, as it minimalises the margin of error throughout the experiment.
When I made the second set of repetitions it was a cold day, which meant that the room temperature of the laboratory was colder than on the previous day. This enabled an extra measurement at 16.0?C to be made without needing to cool the solution.
A
B
Temperature ?C
Time Taken (s)
Temperature ?C
Time Taken (s)
Initial
Final
Average nearest 0.5?C
Initial
Final
Average
5.5
6.0
6.0
20
22.5
22.0
22.5
46
21.5
20.5
21.0
45
32.5
31.0
32.0
25
32.5
30.5
31.5
26
41.5
38.5
40.0
6
42.5
39.5
41.0
4
52.5
49.0
51.0
2
52.0
48.5
50.0
1
62.0
60.5
61.5
8
61.5
58.5
60.0
0
72.5
68.0
70.5
7
71.0
67.0
69.0
2
82.5
74.5
78.5
6
85.0
76.5
81.0
5
Table of Results - Final
Av. Temp A (?C)
Av. Temp B (?C)
Av. Temp (?C)
Time A (s)
Time B (s)
Av. Time (s)
Rate of Reaction
6.0
6.0
20
20
0.008
22.5
21.0
22.0
46
45
46
0.022
32.0
31.5
32.0
25
26
26
0.038
40.0
41.0
41.0
8
4
6
0.063
51.0
50.0
51.0
2
1
2
0.083
61.5
60.0
61.0
8
9
9
0.111
70.5
69.0
70.0
7
2
7
0.143
78.5
81.0
80.0
6
5
6
0.167
Analysing
Analysing the Graph
The graph shows that the rate of reaction increases as the temperature of the reactants increases. Gas is produced more quickly at a higher temperature.
The line of best fit is a straight line, and shows that with every 10?C rise in temperature, the rate of reaction increases by 0.025 (see graph).
This does not support my quantitative prediction I made, as I predicted that the rate of reaction would double. If this was correct, the line would have a steeper gradient. This gradient of line indicates that with every 10?C rise in temperature, the rate does not double but increases by a factor of approximately 1.5, e.g. when going from 40?C to 50?C, the rate increases from 0.06 to 0.085.
The prediction is correct in stating that the rate increases as the temperature increases. This is due to the particles of reactants gaining more energy and speed as the temperature increases, and there is more energy available. This results in an increase of collisions with sufficient activation energy, and so the time needed for the reaction to occur decreases - which means that the rate increases.
Evaluating
Evaluating the Graph
The line of best fit is close to all of the points on the graph, which indicates that the results are quite accurate. Very few of them are exactly on the line however, so error has been made.
In the table of working, the result for the average temperature of 70?C was clearly erroneous and so it was not included when making an average of the time taken. This ensured that the results remained as precise as possible. Making repetitions allowed for a small margin of error to be cancelled out, and also highlighted incorrect results such as this one.
An error made in timing, measuring quantities of reactants, or transferring the results was probably to blame for this incorrect result.
Evaluating the Method
The method was suitable to achieve my aim, as it produced accurate enough results that formed a close line of best fit, and gave a consistent quantitative relationship between the rate of reaction and the temperature of the reactants.
The method was more or less successful, and the few difficulties I encountered during the method were small, but nonetheless significant to the accuracy of the results.
Changes to Method
Surface Area of Marble Chips
* The marble chips were not of identical size and volume and this will have meant that the initial surface area was not consistent throughout the experiment.
? Using more regular sized chips, or powdered marble chips would decrease this problem. However, if using much smaller chips or powder, the rate of reaction would be much quicker and so results would be smaller and less accurate. Therefore the reaction would need to be slowed down, e.g. by using a less concentrated acid.
Volume of Gas
* At a higher temperature, the gas produced had expanded. Therefore the results are underestimated.
? By using a fixed period of time instead of a fixed volume, the container of gas produced could then be kept and cooled to room temperature before recording the volume.
Changes to Apparatus
The apparatus I used was the most precise available. If repeating the experiment, the following apparatus could be used to increase the accuracy of the results produced:
* Burette/Volumetric Pipette
Measuring volumes of liquid reactants is more accurate using a burette or volumetric pipette than with a measuring cylinder.
* Gas Syringe
This would produce more accurate volumes of gas, and would be suitable if the was to be cooled before measuring, as the gas would not escape.
Evaluating the Results
The variables other than temperature were kept as constant as possible throughout the experiment, providing good results:
* The concentration of the HCl was constant throughout.
* The concentration of the CaCO3 changed throughout the experiment, but at the same rate in each measurement.
* The surface area of the CaCO3 was kept as constant as possible (see above).
* The volumes of reactants were kept as constant as possible using the available apparatus (see above).
By using temperature as a variable, my results were more accurate than other members of my class who were changing the concentration. This was due to the changing temperature on different days, and the fact that the reaction is exothermic, so temperature increases throughout the experiment. This worked to my benefit as it counteracted the heat lost during the production of gas, and reduce the gap between initial and final temperatures.
There are enough results collected to provide a firm conclusion, and they all conform. The range covered was large enough, especially due to the extra measurement obtained at 16.0?C, as shown by the consistent line on the graph.
When considering the repetitions made as well, which were very similar throughout, it is possible to conclude that the results in this experiment are reliable.
If repeating the experiment, another set of repetitions would increase support for this statement.
Expanding Experiment
Grace-Marie Smith 1