Also for a fair test
- Roll the trolley down the ramp 3 times for each angle, and then add these 3 results together and divide by 3 to get a mean result.
- Keep the same toy trolley throughout the experiment so the mass and air resistance do not change.
- Roll the trolley from the top of the ramp for every test so this does not affect the stopping distance.
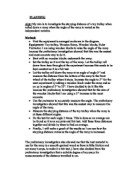
Prediction: I predict that the trolleys stopping distance will increase as the angle of the ramp is increased. I predict that the graph will be this shape:
As the speed of the trolley gets closer to maximum velocity the increase in the distance will be less.
Justification: The faster the trolley is moving down the ramp the larger the stopping distance, because there will be more kinetic energy to overcome the frictional forces on the trolley. Friction is the force which opposes one object moving, or trying to move, over another. In this case it is the trolley moving down the ramp. The amount of friction is directly proportional to the kinetic energy, so the faster the trolley is moving down the ramp, the more friction there is. The frictional force pushes in the opposite direction to which the trolley is moving. Newton’s first law states that every object in a state of uniform motion tends to remain in that state of motion unless an external force is applied to it. When the angle of the ramp is increased the trolley will have more kinetic energy down the ramp and so will accelerate. Kinetic energy is the energy a body has because of its motion. A body of mass (m) starts from rest and is acted on by a steady force (F), which gives it a uniform acceleration (a). In this case m is the trolley, F is the potential energy acted on the trolley when it is let go down the ramp, and a is the acceleration down the ramp. If the velocity of the trolley is (v) when it has the stopping distance of (s), then, using v²=2as, and substituting in F=ma, the expression for kinetic energy is
F=m
Fs is the work done on the trolley to give it its velocity (v) and therefore equals its k.e.
Newton’s second law of motion states that if there are imbalanced forces on an object, the object will move in the direction and exactly proportional to the larger force. So the higher the angle of the ramp, the greater the gravitational potential energy and so the trolley will move down the ramp faster, making a longer stopping distance. Potential energy is the energy a body has because of its position or condition. A body above the Earth’s surface is considered to have an amount of gravitational potential energy equal to the work that has been done against gravity by the force used to raise it. To lift a body of mass m through a vertical height h at a place where the Earth’s gravitational field is g needs a force equal and opposite to the weight mg of the body. Therefore
work done by force = force X vertical height
=mg X h
Newton’s third law of motion states that for every action there is an equal and opposite reaction. Therefore the larger the angle of the ramp the more potential energy there is, so there will be more potential energy to be transferred into kinetic as it reaches the bottom of the ramp. The increase of the stopping distance will be less as the trolley becomes close to maximum velocity. This is because at maximum velocity the trolley cannot move any faster, and the velocity of the trolley will be directly proportional to the stopping distance, so when the speed does not increase the stopping distance will not increase.
OBTAINING EVIDENCE
Results
The results were obtained by carrying out the experiment as planned.
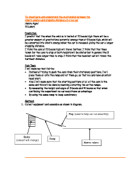
The toy trolley was rolled down a wooden ramp onto a smooth surface in a corridor with the ramp at angles 0° to 25°. The angle of the ramp was measured using a protractor. The stopping distance of the trolley was then measured using a metre ruler. Each angle was done three times so an average could be obtained.
Observations
- When the toy trolley was dropped from a higher angle, there was more kinetic energy when it hit the ground. This caused more friction, causing the trolley to slow down. This may have changed the results.
- The trolley did not always move in a straight line. This means it travelled a greater distance than was measured and so this made a difference to the results.
- Sometimes, the trolley hit the wall on the way down, which could have slowed it down.
ANALYSIS
I have discovered that the stopping distance of a toy trolley when rolled down a ramp increases at a uniform rate as the angle of the ramp from which it is dropped is increased.
The graph shows that, as expected the stopping distance increases as the angle of ramp increases. It also shows that it increases at a steady rate, because the line of the graph is fairly straight, and not a curve.
Conclusion
The results show that the prediction was correct because the stopping distance of the toy trolley increased at a steady rate. This is because Newton’s first law states that every object in a state of uniform motion tends to remain in that state of motion unless an external force is applied to it. When the angle of the ramp is increased the trolley will have more kinetic energy down the ramp and so will accelerate. Newton’s second law of motion states that if there are imbalanced forces on an object, the object will move in the direction and exactly proportional to the larger force. So the higher the angle of the ramp, the greater the gravitational potential energy and so the trolley will move down the ramp faster, making a longer stopping distance. Newton’s third law of motion states that for every action there is an equal and opposite reaction. Therefore the larger the angle of the ramp the more gravitational potential energy there is, so there will be more potential energy to be transferred into kinetic as it reaches the bottom of the ramp.
The prediction was also incorrect because the graph has a straight line of best fit rather than a curve. This is because in the small distance that the trolley is accelerating, it is not close to reaching maximum velocity. If the ramp was a much larger size, the toy trolley would have a chance to reach maximum velocity and so the graph would be a curved shape. This is because at maximum velocity the trolley cannot move any faster, and the velocity of the trolley will be directly proportional to the stopping distance, so when the speed does not increase the stopping distance will not increase.
Evaluation
The line of the graph is accurate as it a straight line through the origin as in the preliminary experiment. The results, however, do not show to be accurate as they are considerably higher measurements to those in the preliminary investigation. This may be because of my measuring technique with the protractor. The ruler that I used could have been more accurate, as it only measures to a minimum 1mm. The ruler was not suitable for the experiment as it is only 1 metre long, and the stopping distance was as high as 6 metres. This therefore reduced the accuracy. As an improvement, a tape measure could be used to measure the stopping distance, because this can measure over 6 metres and would be more accurate over a longer distance. There were several inaccuracies with the way the trolley rolled down the ramp. Firstly, the trolley hit the flat surface hard at the bottom of the ramp, causing a lot of friction and so slowing the trolley down, and making the stopping distance shorter. When the ramp was at a higher angle, the trolley had more kinetic energy at the bottom of the ramp, so it hit the ground harder, causing more friction and therefore slowing the trolley down more. As an improvement, the bottom of the ramp could be curved, which would soften the impact of the trolley hitting the flat surface. This would therefore reduce the friction. Also, the trolley sometimes hit the wall while travelling along the flat surface. This caused friction, making the trolley have less kinetic energy. This made some results of the same ramp angle have considerably different stopping distances, and could have created anomalous results. As an improvement, the experiment could be carried out in an open area, so there is no wall for the trolley to hit. There are many other ways in which the method could be improved. One way is that more readings could be taken, so the average is more accurate. The range of readings could be greater so there are more points on the graph, so it is clearer to determine the line of best fit. I could have used trigonometry to work out the angle of the ramp rather than using a protractor, as this would depend less on human judgement. A smoother surface could be used for the trolley to exit the ramp on to. The surface that I used had lots of random bumps on it making the friction level different on every test. A different surface could be used for the ramp. The smooth, grained, wooden surface sometimes made the trolley spin down the ramp and so a rougher surface would stop this from happening. The wheels on the trolley sometimes lost control, and got stuck. This could be solved by using a trolley with larger wheels, to overcome the friction. I think that if I repeated the experiment, I would get different results because the surface of the ramp and the surface of the floor would be different, meaning the friction would be different. Also, the trolley used could be different. Because I have not determined a specific way to release the trolley, this could change, or the person releasing the trolley could change, therefore changing the speed of the trolley. This could be made more accurate by releasing the trolley using an electromagnet. The way in which the stopping distance is measured could also vary if I repeated the experiment. All of these unreliabilities make the experiment less accurate. I could extend the experiment by varying one of the other variables. For example, I could change the surface of the ramp and therefore vary the friction. Or, I could use different trolleys to see what difference the size of the wheel makes to the stopping distance. Speed of the trolley could be measured, instead of the stopping distance, to see whether this graph would correlate with the graph of stopping distances. Weights could be added to the top of the trolley to see what difference the mass of the car makes to the stopping distance at the same angle of ramp. Finally, the position of the car on the ramp could be varied at the same angle of ramp to see what effect this has on the stopping distance.