Variables
Constants
Temperature
Usually, an increase in temperature is accompanied by an increase in the reaction rate. Temperature is a measure of the kinetic energy of a system, so higher temperature implies higher average kinetic energy of molecules and more collisions per unit time. A general rule of thumb for most (not all) chemical reactions is that the rate at which the reaction proceeds will approximately double for each 10°C increase in temperature. Once the temperature reaches a certain point, some of the chemical species may be altered (e.g., denaturing of proteins) and the chemical reaction will slow or stop. In this case, the experiments were carried out at room temperature (approximately 22°C). However, I was unable to accurately control the temperature of the environment.
Medium
The rate of a chemical reaction depends on the medium in which the reaction occurs. It may make a difference whether a medium is aqueous or organic; polar or nonpolar; or liquid, solid, or gaseous. In this case the medium is liquid and aqueous.
Presence of Catalysts and Competitors
Catalysts lower the activation energy of a chemical reaction and increase the rate of a chemical reaction without being consumed in the process. Catalysts work by increasing the frequency of collisions between reactants, altering the orientation of reactants so that more collisions are effective, reducing intramolecular bonding within reactant molecules, or donating electron density to the reactants. The presence of a catalyst helps a reaction to proceed more quickly to equilibrium. Aside from catalysts, other chemical species can affect a reaction. The quantity of hydrogen ions (the pH of aqueous solutions) can alter a reaction rate. Other chemical species may compete for a reactant or alter orientation, bonding, electron density, etc., thereby decreasing the rate of a reaction. In this case, no catalysts were present and I was very careful to both wash out and dry the flask after every use, so that subsequent reactions would not be contaminated with the products from previous ones.
Independent Variable
The concentrations of the reagents, sodium thiosulphate and nitric acid.
Dependent variable
The time taken for the cross, drawn on the paper we placed beneath the reacting flask, to disappear.
Implementation & Analysis
Procedure for experiment
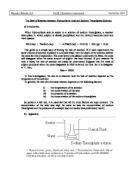
The equation for the reaction whose rate we will be measuring is as follows:
S2O32- (aq) + 2H+ (aq) S (s) + H2SO3 (aq)
The reaction is easy to follow since one sulphur atom is formed for each thiosulphate ion reacting, and the sulphur makes the reacting solution more cloudy as its concentration increases. We will place the reaction vessel over a black cross, drawn on a white background. The black cross will disappear from view, owing to the increased sulphur concentration in the solution, when a fixed amount of reaction has taken place. In this way, the rates of reaction of solutions of differing concentrations can be compared, and the effect of changes in concentration found. This is because the time taken for this fixed amount of reaction is directly proportional to the rate of reaction; that is, if the reaction is fast, the cross will disappear quickly and vice versa.
I performed an initial trial run using 6 cm3 of sodium thiosulphate,
4 cm3 of water and 10 cm3 of nitric acid. On the basis of the time that the cross took to disappear in this case, I then planned a further three runs of the experiment, in which I varied the concentration of thiosulphate, whilst maintaining the acid concentration constant at 10 cm3. I therefore chose to run the experiment with 8 cm3 of thiosulphate (a third more than in my trial run), then 4 cm3 (a third less than in my trial run), and finally 2 cm3, (a third of that used in my trial run). This meant that the concentration of thiosulphate was 0.1M for my third run, (please see results tables), double this for my second run, triple for my first run, and quadruple for the fourth run of the experiment.
Subsequently, I conducted another four experiments where the thiosulphate concentration was kept constant at 6 cm3 and the nitric acid concentration was varied. I chose to use volumes of acid of 2 cm3, 4 cm3, 6 cm3, and
8 cm3. This meant that the eighth run was 0.01M, the seventh run was double this, the sixth run was triple this, and the fifth run was quadruple this concentration.
Throughout this procedure, I had to remember to adjust the volume of water that I added to the reacting solution, so that the total volume of the solution was the same in each case, (20 cm3). In addition, I tried to ensure that the concentration changes I used varied by a factor of around five overall, so that the times for the experiments were neither too long nor too short, as this would affect accuracy. In each case, I timed with a stopwatch how long it took for the cross I had drawn on the piece of paper, (which I then placed under the flask), to become completely obscured by the formation of sulphur as follows:
Below is a brief and diagrammatic outline for the experimental procedure. Please see separate tables of results for complete experimental data.
After this I carried out the calculations needed to complete the tables of results:
Firstly, I calculated the correct molarity of the reagents, as one solution dilutes the other. The molar concentration of a solute is by definition the quotient of the amount of solute substance present, in moles, and the volume of solution present, in litres (L or dm3).
Subsequently, I determined the reaction rate for all the experimental runs by calculating 1/time for each reaction. In order to make the resulting figures for 1/time easier to plot, I then multiplied them by 10-2. Using the figures obtained from these calculations, I plotted two graphs, drawing the best line through the points on each graph. Please see separate sheets for plotted graphs.
Conclusion & Evaluation
Precision of measurements & accuracy of experiment
Experimental error is always with us; it is in the nature of scientific measurement that uncertainty is associated with every quantitative result. This may be due to inherent limitations in the measuring equipment, or of the measuring techniques, or perhaps the experience and skill of the experimenter. It goes without saying that, when conducting this experiment, I endeavoured to be as careful and as accurate as I could in my measurements. However, there are several areas where precision could be improved:
- I had to measure out my reagents and water using three burettes, which were set up on one of the lab benches. I found these a little difficult to read at times, as they were placed significantly higher than eye level. Therefore, it was not always possible for me to measure out these volumes as accurately as I would have liked.
- I should have started the stopwatch at the exact time I put the water and the sodium thiosulphate into the conical flask containing the acid. This is not always possible when conducting the experiment alone, as it is also important to ensure that the reagents are properly homogenised for the reaction to occur. It is difficult, therefore, to do all these things simultaneously.
- For each run of the experiment, I ensured that the amounts of reagents were diluted within a certain range, so that the speed of reaction was not too fast. In this way, I minimised the possibility of gross error, in as much as none of my reactions were to fast to follow properly, and any errors in timing the reaction would be lessened over the longer time period.
- The crosses used were not standardised, with some being fainter than others. Needless to say, this could definitely affect results, especially if the cross is very dark, as this will take much longer to be obscured by the formation of sulphur in the reacting solution. Using standardised crosses for a repeat experiment would be a good idea.
- Looking for an end point in the reaction can be very subjective. Although this reaction had a fairly definite end point, it would still be difficult to provide a universally applicable definition of “obscured” for the disappearing cross. However, the following could be done to standardise this aspect of the experiment:
A light could be attached to a stand and clamp and then connected to a sensor, which would receive a signal from the light to stop the clock when the solution was cloudy enough to make the cross disappear. This set-up would give me a more accurate reading of the end point of the reaction than simple observation. A diagram of this apparatus is shown below.
-
One set of measurements alone is not usually very reliable. In order to obtain reliable results, it is necessary to carry out the investigation more than once. Obviously, the more replicates, the more reliable my results will be. This however, has to be balanced against the time constraints of repeating the procedure numerous times. I only had time to take one set of measurements. It was opportune, therefore, that my results contained no glaring anomalies. This was borne out by the resulting graphs of concentration of reagents against rate of reaction. If I had had more time, however, I would have liked to have replicated the experiment at least twice more, and then averaged out the results, in order to minimise random errors and impart more credibility to them.
-
I could have conducted some preliminary analysis, such as graphing the points I had found, and eyeball-fitting a line on the graph, in my notes while I was doing the experiment. In this way, I would have been able to notice whether something was amiss right away, rather than after I had completed the whole experiment. This would obviously have helped to detect any anomalies much earlier.
- I have tried to restrict all calculations to a sensible and meaningful number of significant figures, as a consequence of the possible errors and inaccuracies mentioned above.
Different kinds of error
Several kinds of errors are usually present in experimental data. Their effects on the desired results can range from insignificant to disastrous, depending on how well they are understood and accounted for.
Systematic errors are consistent effects which change the system under
study or the measurements you make on it. They can consist of, for example:
- Uncalibrated instruments (balances, etc.)
- Impure reagents
- Leaks
- Temperature effects not accounted for
- Biases in using equipment (even numbers in reading scales, seeing
hoped-for small effects, etc.)
Systematic error affects the accuracy of an experiment but not the precision. Repeated trials and statistical analysis are of no use in eliminating
its effects. Careful experimental design and execution is the sole approach to reducing systematic error. In this particular experiment, systematic error could have come from the temperature of the environment, which I was unable to control. Indeed, I noticed that, as the experimental session continued, the atmosphere in the laboratory did seem to warm up. I do not think that there were other factors which could have caused drastic systematic error in this case.
Random error arises from mechanical vibrations in the apparatus, electrical noise, uncertainty in reading of scale pointers, and other “fluctuations”. It can be characterized, and sometimes reduced, by repeated (at least three) trials of an experiment. Note that random error affects the precision of an experiment, and to a lesser extent its accuracy. I have already remarked that I would have liked to perform more replicates of the experiment.
As I have previously mentioned, I believe that the positioning of the burettes accounted for some error in measuring out the volumes of reagents for this experiment. In addition, when conducting the second run of experiments (with the concentration of thiosulphate constant and concentration of acid varied systematically), I erroneously added all the water necessary to keep the total volume of the reacting solution constant to the thiosulphate. This I did, instead of sharing the water appropriately between acid and thiosulphate correspondingly, in order to bring both their respective volumes up to 10 cm3. I noticed this error when attempting to work out the molarity of each reagent, and therefore repeated this series of experiments, with the correct amounts of water. I noticed that the reacting times were 2-3 seconds slower for each reaction. This is due to collision theory and how it affects reactions rates, which I have explained earlier in this report. I believe that the way in which I had set out my initial table of results contributed to my making this error. As can be seen, I have therefore set my final tables of results out very differently from the one I had drawn when planning the experiment.
Determining the rate equation
The equation for the reaction whose rate we have been measuring is as follows:
S2O32- (aq) + 2H+ (aq) S (s) + H2SO3 (aq)
The rate equation states the relationship between the rate of reaction and the concentration of each reactant. The dependence of the rate of reaction on the concentration of a reactant can be expressed mathematically in the form:
Rate ∝ [reactant]n
which gives the rate equation as:
Rate = k [reactant]n
where k is the rate constant and n is the order of the reaction with respect to the given reactant. The order of reaction is the power to which the concentration of the reactant is raised in the experimentally determined rate equation. The definition of order of reaction states that the rate equation must be determined by experiment, and has nothing to do with the stoichiometric equation. From my experimentally obtained results, I will work out the orders of reaction with respect to each reactant, and hence write the overall rate equation.
Let us begin by looking at table 1 (please see separate page), where the concentration of 0.1M nitric acid is held constant and the concentration of 1M thiosulphate is varied systematically. We can see that, as the concentration of thiosulphate doubles, then the rate also doubles (run 3 and run 2); as the concentration of thiosulphate trebles, then the rate also trebles (run 3 and run 1), and so on. Therefore we can write:
Rate ∝ [S2O32- (aq)]
Let us now look at table 2 (please see separate page), where the concentration of 1M thiosulphate is held constant and the concentration of the 0.1M nitric acid is varied systematically. We can see that as the concentration of acid doubles, the rate of reaction also roughly doubles (runs 8 and 7), and so on. Therefore we can write:
Rate ∝ [H+ (aq)]
Combining the two reaction rates gives:
Rate ∝ [S2O32- (aq)] [H+ (aq)]
Therefore, the rate equation is:
Rate = k [S2O32- (aq)] [H+ (aq)]
The reaction is first order with respect to [S2O32- (aq)], because in the rate equation the power to which this concentration is raised is 1. It is also first order with respect to [H+ (aq)], because the power to which this concentration is raised is also 1.
Extension
This experiment could be extended to investigate the effect of other variables, such as temperature or presence of catalysts, on the rate of reaction.
When the temperature is increased, the reacting particles will have more energy and thus move faster. Temperature is a measure of the kinetic energy of a system, so higher temperature implies higher average kinetic energy of molecules and more collisions per unit time. A general rule of thumb for most (not all) chemical reactions is that the rate at which the reaction proceeds will approximately double for each 10°C increase in temperature.
Catalysts lower the activation energy of a chemical reaction and increase the rate of a chemical reaction without being consumed in the process. Catalysts work by increasing the frequency of collisions between reactants, altering the orientation of reactants so that more collisions are effective, reducing intramolecular bonding within reactant molecules, or donating electron density to the reactants. The presence of a catalyst helps a reaction to proceed more quickly to equilibrium
Conclusion
My initial aim was to measure the rate of reaction of thiosulphate ions with acid in solution, and discover how the rate depends on the concentration of both thiosulphate and acid. I successfully conducted the experiments that enabled me to do this. In addition, I confirmed my prediction that the time taken for the fixed amount of reaction to take place, (the cross disappearing), is directly proportional to the rate of reaction; that is, if the reaction is fast, the cross will disappear quickly and vice versa. In addition, the shape of the lines on my graphs suggested that this is a first order reaction, and I worked this out using my results.
As can be seen from my results tables, during the fourth run of the experiment, where the concentrations of nitric acid and thiosulphate were at their highest, the cross disappeared most quickly (in only 19 seconds). Conversely, in the eighth run of the experiment, where the concentrations of nitric acid and thiosulphate were at their lowest, the time taken for the cross to disappear was the longest. This indicates that the higher the concentration of reagents, the faster the reaction will be for this experiment. If we plot a graph of time against concentration, the results show that the cross disappears soonest when the solution is most concentrated. The graph would appear as shown below, (please see separate tables of results for data used):
We can see from the graph that:
Speed of reaction ∝ Concentration of thiosulphate
If we draw the same type of graph, but this time showing the concentration of nitric acid being systematically varied, we find that the graph looks the same as previously (please see separate tables of results for data used):
We can see from the graph that:
Speed of reaction ∝ Concentration of nitric acid
Once again, this is due to the collision theory and how it affects reactions rates. I have already expounded the basic tenets of this theory at the beginning of this piece. Kinetic theory may also be relevant to this, as it relates molecular speeds to the Maxwell distribution function, enabling estimation of mean free path and frequency of collisions between molecules.