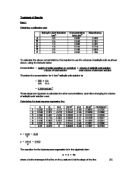
y = a + bx
where a is the intercept of the line on the y-axis and b is the slope of the line. [1]
[2]
b = 0.2103 = 5.2184
0.0403
a = 0.602 – (5.2184 x 0.12) = -0.0242
Therefore the equation for the least squares regression line is:
y = 5.2184x – 0.0242
Part 2
Interference Studies
The table above shows the results obtained for this part of the investigation. It can be seen that caffeine and acetaminophen have a much lower concentration than acetylsalicylate and salicylamide which suggests that these two compounds are not present in the aspirin. However, with previous knowledge, we know that acetylsalicylate and salicylamide are present in aspirin, which explains a higher concentration than the other two compounds.
Part 3
Optimisation of the conditions for the hydrolysis of acetylsalicylate
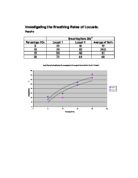
The results obtained above shows the reaction time for the amount of salicylate formed for ten minutes.
Referring to the graph, it can be seen that there is a relatively linear relationship which suggests that the reaction may have completed by the time the absorbances were measured. The first reading was taken at 30 seconds and every minute thereafter. Another reason for the linear relationship could also be that the reaction taking place is very fast and we were unable to measure the absorbances at the initial rate.
Part 4
The assay of the aspirin content of a tablet
Calculating the w/w% aspirin in the tablet
Weight of aspirin = highest concentration of salicylic acid solution x
dilution factor x total volume of solution (dm-3)
Dilution factor = total volume .
volume of salicylic acid solution used
Therefore:
Weight of aspirin = 0.2400 x 12.5 x 250
2.5 1000
= 0.3g
Therefore w% of aspirin = weight of aspirin x 100
weight of tablet
= 0.3 . x 100
0.3352
= 89.4%
Calculating the 95% confidence interval
[1]
where μ is the true mean, x is the measured mean, s is the measured standard deviation, n is the number of measurements and t is the value from the “Students t” table
x = 0.4526 = 0.1509
3
s = Σ(xi-x)2 = 0.00041909 = 0.0145
n – 1 2
t = 4.303
n = 3
Therefore:
μ = 0.1509 ± (4.303 x 0.0145)
√3
μ = 0.1509 ± 0.0360g
From this we can now compare the result for the weight of aspirin with the amount specified on the container. The amount specified on the container is 0.3g. However, the result for the weight of aspirin that we obtained is also 0.3g. This suggests we were able to collect all the aspirin that is found in the tablet.
Discussion
Although there are many parts to carrying out the assay, there are main points that should be considered whilst implementing the procedure.
- Ensure that all the compounds that required weighing are transferred to the beaker without any spillage. Ensure that no powder or solution is lost during the experiment as this can affect the final result of the purity of aspirin in the tablet.
- Due to the problem of measuring the absorbance of the required solutions, ensure to minimise the delay of measuring the absorbances of the solutions and to avoid keeping samples in direct sunlight, as this can affect the absorbance of the solution.
Limitations
General limitations that may have occurred during the experiment could be:
- Human errors – not transferring all the powdered tablet to the beaker. Although we received a high value for the w/w% aspirin in the tablet, some powdered tablet may have been lost whilst transference.
- Not measuring the absorbances of the solution as quickly as possible. Sunlight could have affected the variation of results we had obtained.
- Not withdrawing aliquots of solution at regular intervals. This served to be a major problem for part 3 of the investigation as we were unable to collect results for the initial rate of the reaction. The graph shows that the reaction had completed by the first minute of the reaction had ended.