Prediction:
When I change the input variable, the height the ball is from the ground, I believe the Distance the ball rolls will be proportional to that change. As I increase the height of the ball from the ground, the distance it rolls will increase.
I think this because when an object is placed higher above the ground, it gains more energy; this energy is in the form of gravitational potential energy. This means it has the potential to be converted into kinetic energy through gravity. The higher something is the stronger the pull of gravity is, therefore, more energy will be transferred to kinetic energy from the potential energy the object has. The more kinetic energy something has, the quicker it can move, therefore, it will probably be able to travel a further distance. When the ramp is higher the ball will also be higher off the ground, it will have more potential energy, and that means gravity will pull it down with more force, resulting in more kinetic energy, meaning the ball will roll faster and further.
Equipment:
1x wooden ramp (130cm)
30x Exercise books
1x Metre rule
1x Marble
Method:
I will use a 130cm ramp for the ball to roll down. The ramp will be held up with books, when it needs to be higher I simply ad more books. I will release a marble (24.5 grams) at a set point on the ramp, 10cm from the highest end, and record how far it rolls from the lowest end of the ramp, where the ramp hits the floor using a tape measure. Each time I take a recording I will change the height of the ramp; this will be done using a ruler so the difference in height can be recorded. I will start of with only 4 books, and then add more after every recording. I didn’t want to keep the difference in height consistent; I think it will be better if the difference in each height change was different, this would show a more reliable pattern on my graph.
When carrying out the experiment I plan to keep it as fair as possible. I will do this by making the equipment and the surroundings the same every time I do a test. I will always use the same board and ball, the ramp shall be placed in exactly the same place so the ball with roll on the same surface and I shall do all tests in the same place, in a hallway of a building. I will also make sure the ball is released in the same place each time. The front of the ball will be lined up with line on the board every time I do a test, this will avoid complications on how to place the ball on the ramp and keep it a fair test.
I will measure the distance the ball rolls. This will not include the distance of the ramp; therefore I shall measure from the very end of the lowest point on the ramp. Each time I release the ball I will measure exactly how far it rolls from the ramp by using a tape measure. To make sure my experiment will be accurate I will take all recordings in measurements to millimetres.
I will take multiple sets of recordings to make the experiment very reliable. In addition, each time I take a single recording I will take it once more; I will then get the average of the two. When I have multiply sets I will then take the averages.
From my test run I am going to put two metre rules on the ramp. They will act as a runway for the marble to roll down; this will hopefully stop it veering off to the sides.
Results:
Conclusion:
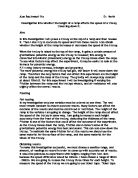
The graph shows positive correlation. The line of best fit goes up in a diagonal straight line It is clear that the ‘height of the ball from the ground’ is directly proportional to the distance the ball rolls. As the height of the ramp increases, the distance the ball rolls increases.
This is because when the ramp is raised higher the marble has more gravitational potential energy. This energy is stored in the marble because it is above the ground and gravity is acting upon it. When the marble is released the gravitational potential energy is transferred into kinetic energy, the ball then rolls down the ramp. The more GPE the ball has, the more energy converted into Kinetic energy when it is released, therefore the further the distance the ball rolls.
My Prediction was correct. I anticipated that as the height of the ball from the ground increased, so would the distance it travelled when released. I am confident it was correct because my graph backs this up.
I did not spot any anomalies in my results. Every point on the graph follows the same pattern; my results seem to be reasonably accurate.
Evaluation:
I tried to make my experiment as fair as possible. To a certain extent this was achieved, however some aspects on the fairness of the experiment could have been improved. In the corridor were the experiment was carried out there were factors which could have affected how far the ball rolled. Firstly, the direction of the ball was not consistent. After it had finished rolling down the ramp the ball was free to move in any direction, often it would veer off to one side. This made the distance the ball had to go further, possibly meaning the end recording was not completely fair. This could have been resolved by setting a runway for the ball, perhaps a ruler each side, like on the ramp. Secondly, the surface the ball rolled on would have been different each time; it didn’t always follow the same path. This means on some tests the ball may have hit a bump or dust in the carpet causing it to slow down. This could have dramatically affected the end recording. On future experiments the surface would have to be hovered first and a smoother surface like acrylic would have been much fairer. The corridor was in constant use while the experiment was underway. People were walking in out of the door at either end; this would have caused drafts which may have affected the speed of the ball. Next time the experiment would have to be in an isolated location, with nothing that could alter the air flow in the room. When the ball was released there was always a chance of accidentally knocking the ball when moving my hand away. A release mechanism would have been much fairer. An electro magnet and a steel marble would have worked well. It would require no contact with anyone’s hands, there would be less room for error.
The measurements were taken using a metre rule. This meant we had to mark each metre with our thumb and loose accuracy. A tape measure which was rolled out at the beginning and wasn’t moved during the whole experiment would have been much more accurate. All the readings we took were to the nearest millimetre, I felt it was almost impossible to be anymore accurate. Also, the distance between the metre rule and marble was often too big to record accurately; we had to just use our eyesight as accurately as possible. Another metre rule would have been useful; we could line it up with the marble and accurately got the distance it rolled.
To have made the experiment more reliable I should have done multiple recordings for each test. 3 recordings for each test and then the average would have given me a reliable set of results. The experiment would also be repeated multiple times itself; this would show how reliable it was. My graph shows my experiment was reliable; the crosses are very close and follow an almost exact pattern.
I am confident that my conclusion is right because it is the only explanation for the coherent set of results. If I repeated my experiment I am sure I would find a pattern very much the same, depending on how well I kept the test fair and accurate.