Turgor Pressure - Turgor pressure or turgidity is the negative internal pressure in a cell resulting from . i.e. the produced by a solution in a space divided by a differentially due to a differential in the concentration of solute.
Hypothesis
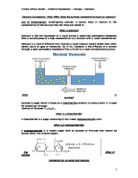
I predict that when there is a strong concentration of sucrose the water molecules from within the potato piece will leave the potato and go into the sucrose – as sucrose has a high concentration of sugar and a low concentration of water, this is following the laws of osmosis. After the process has occurred the cell of the potato will become flaccid. Also, as the amount of sucrose in the solution increases the potato chip will shrink more and as the amount of distilled water increases in the solution, the potato chip will swell and become turgid.
I predict that the more water in the solution the more the potato cell will swell, which would make it turgid. This will increase the overall mass of the potato, but the cells will not burst because the cellulose cell wall is inelastic. Due to the turgor pressure the contents of the cell start to push against the cell wall and give support to the plant tissues.
Variables
In the investigation there are many different variables which could affect the outcome (results) of the experiments. These are:
-
The size of the potato chip: The size of the potato chip should be small enough to fit inside the tube, but it should not be too small. The size should be big enough to notice a result in mass after the experiment. I will control this variable by cutting and measuring the mass on weighing scales.
-
Sucrose Concentration: The concentration of the sucrose should not be too high otherwise the molecules of the potato will move towards it too quickly and the mass of the potato will increase too quickly. It should not be too low otherwise the potato will increase in size as the water molecules will move from the solution into the potato. I will control this variable by using the same concentration of sucrose in every experiment but will be changing the volume.
-
Volume of Sucrose: The volume of sucrose is the variable which I will be changing. This is because by changing the volume of sucrose but keeping the volume of the solution constant, the concentration of sucrose becomes more diluted. Thus, from there we can see the effect of different concentrations on osmosis.
-
Temperature: The temperature must remain constant to keep the investigation fair. The experiments should be carried out in the same room with the same apparatus to keep reliability of results up to a high standard. It should remain at room temperature to ensure reliability and fairness.
-
Time: Each experiment should be recorded up to a certain time. It should not be too long or there would be enough time for the water molecules to move in or out of the potato producing obscene results. If it is not long enough then there wouldn’t be enough time for osmosis to occur. The time should remain the same throughout each of the experiments to ensure it is fair and to ensure that the results are comparable.
Method
Apparatus
Apparatus:
- Potato
-
Scalpel
- Ruler
- Test Tubes
- Sucrose Solution
- Measuring Cylinder
- Distilled Water
- Cutting plate
Experiment Instructions:
- Firstly I will make sure that all the potato chips weigh roughly the same. Also, I must make the surface area available the same. Each of the potato chips will be cut 3cm by 1cm by 1cm.
- After weighing the potato chips I will place them into 5 different test tubes. Now I must make the solutions of distilled water and sucrose concentration. The concentrations will vary by: 5ml in each test tube:
- I will add the different volumes of sucrose to water into different test tubes.
- Then I will leave the solution over night and measure the results the next day.
Each experiment will be repeated 3 times and an average will be made to increase result accuracy.
Safety
Safety is a major issue. Since we are dealing with 100% sucrose solutions goggles are needed to protect the eyes. If sucrose does get in anyone’s eyes then it needs to be washed out with cold water immediately.
For this experiment all of the glassware should be kept away from the edge of the table to avoid knocking them off and smashing them.
Also, the scalpel must be used only when the potato is on the white cutting board. It must be used carefully and in close proximity of other people – that way if an accident does occur someone is there to help.
Reliability
I have tried to make the results reliable by using distilled water rather than normal tap water – this is to eliminate the possibilities of their being impurities in the water.
Also the measuring cylinder must be washed, cleaned and dry before taking measurements – to prevent the next mixture being inaccurate. There are two measuring cylinders which were used so these must both be clean.
The potatoes used were all from the same packet for a larger chance of their not being any anomalies. Furthermore, I will repeat the experiment three times and take the average measurement in an attempt to get the most reliable and accurate results possible. Moreover, I rolled the potato in a tissue before weighing after it had been taken from the test tubes.
Preliminary Studies
As part of my preliminary studies I undertook one experiment of each concentration. I am to try and conclude:
- If the length 4cm by 1cm by 1cm is good enough.
- If I will keep the concentrations as they are.
- If the method should remain the same.
Implications of Preliminary Studies
- If the length 4cm by 1cm by 1cm is good enough.
4cm took a long time to cut and the length was quite long – the top of the potato was barely contained in the 20 cm3 solution. From the preliminary I can see that using 4cm would be a mistake. Instead I am going to use 3cm. Each potato will be cut 3cm by 1cm by 1cm and then put in the solution.
- If I will keep the concentrations as they are.
I think that the concentrations used are fine and the results they gave me are comparable and reliable. Making each of the solutions was remarkably easy – as I had all the resources at my hands.
- If the method should remain the same.
I think that the method used was efficient and easy. It was extremely easy to repeat and since I have carried it out so many times I have gotten used to it. The method will remain the same.
Other Implications of the Preliminary Studies
There were many other things I learnt that will affect the main experiment:
- I must clean the test tubes prior to my experiment otherwise there will be a build up of a brown substance in a test tube – which could possible be dirt and would definitely affect my results.
Blank Table of Results
Each of the results will be put in a table like this. There are three rows to write in because three experiments were conducted for each concentration. The % Sucrose column is there to show how much of the solution was sucrose and the % water column is there to show how much of the solution was water. The volume column is there to show that the volume of the entire solution remained the same. The initial mass column shows the mass of the potato before it is put in a solution and the final mass column shows the mass after the potato is put in the solution. The change in mass column shows the difference between the Initial mass and the final mass. The average change in mass is the average of all three experiments. The % difference is the percentage difference from the Initial mass and final mass – the average % difference is the average of all three of the experiments.
Actual Results
Analysis of Results and Graphs
After the completion of the investigation I can conclude that accurate results were produced. This can be seen in my graphs – they points are all in close proximity of each other.
There are many different ways of presenting the data collected from my investigation. I chose to present them in two ways – tables and graphs. The first way I presented them – through tables, is useful for showing exact numerical values for calculations. However, from a table it is difficult to identify trends, so I plotted graphs containing all of the data – this would make it much easier for identification of any trends.
From the data collected (mostly the graphs showing the results) I was able to identify certain trends. The graph which shows the ‘Average Change in Mass against the Concentration’ clearly shows the relationship of how increasing the concentration of the sucrose solution forces the potato to lose more mass. Thus proving that if the concentration of sucrose solution increases the mass of the potato will decrease. The graph shows a relatively straight line – this indicates that the concentration shows a directly proportionally link to the mass. Someone may argue that this proves that my results are wrong. Nevertheless the graph showing the Change in Mass against concentration shows me that my results are accurate as the three lines of best fit are extremely close together at all of the points. This shows me that my results are at an accurate and consistent level.
From my results I can see that as the concentration of sucrose increases, there is a gradual increase in the percentage change of the potato mass or to put it in another way, the average percentage difference becomes greater.
At maximum concentration (2M) the potato has lost the most mass (- 54%) becoming flaccid. This suggests, the concentration gradient was at its highest – hence the maximum rate of osmosis occurred at this concentration. However, as the sucrose concentration changed to smaller values the loss in mass from the potato (hence osmosis) also decreased. At 0.5 M concentration I discovered that the change in mass was almost 0%. This means the concentration of both sucrose and water molecules on wither side of the semi-permeable membrane (potato walls) was almost equal and had nearly reached equilibrium – the concentration gradient was almost 0.
When the concentration of sugar became zero i.e. the solution was entirely water, I found that the potato had gained mass (19%). Osmosis of water molecules is now occurring back into the potato – the potato cells have now become turgid.
From these results I can confidentially conclude that my prediction was correct. At higher sucrose concentrations the potato lost mass and became flaccid, and at low sucrose concentrations – when the solution was made of mainly water molecules, the mass increased. This would be due to the osmosis occurring – the water molecules moving from the low concentration of sucrose or distilled water to the stronger solution in the potato, through the semi-permeable membrane – the cell wall.
Evaluation
Overall, the investigation went really well. Having carried out a preliminary experiment, I was in a position to make justified changes if necessary and therefore approach the task more efficiently. I think that the practical was carried out well by my group and the results I obtained were very accurate.
After studying both graphs and all the tables I have come to the conclusion that there were no anomalous results. This is because all of the values in the tables are in close proximity of each other and all of the plotted points in the graphs are also consistently near each other showing that my results were accurate throughout.
I think that the procedure that was used was efficient and dependable upon. I had written in the plan what I would try to achieve and the method which was going to be used and I stuck by it throughout the entire investigation. This way I became more experienced in conducting the experiment each time and the results accuracy strengthened even more. If I were to redo the investigation I would not change the procedure but instead would add to it. I would add using a cork boror to cut the potato out – so each would be the same size and there would be less hassle of cutting the potato with a knife/scalpel.
After the investigation, I feel that the results are completely reliable and dependable upon. Definite patterns can be seen from the graphs and tables. As the amount of sucrose concentration increases the mass of the potato decreases. This pattern is seen clearly in all of the data – whether it be graphs or tables.
However accurate the results were there were many possibilities which could have limited the accuracy of the results. Firstly, it could be possible that the concentration of the sucrose was not already precisely 2molar when I received it. Another major factor is the surface area – my skills with a scalpel are limited and even though I cut all the potato to 3cm by 1cm by 1cm I may have left more surface area over on one of the potatoes – resulting in faster osmosis. This problem could easily be solved if a cork boror is used to cut the potato. To increase accuracy, the experiment could have been carried out even more times. I could also have tested a larger range of concentrations to expand my investigation. Furthermore I could have measured the mass in intervals rather than after 24 hours e.g. every 2 hours and I could have also let the investigation run longer than 24 hours – this way I could possibly find the saturation point. Moreover I could have weighed the potatoes on a more accurate scale e.g. not to 0.00g but to 0.0000g.
To further research the field of osmosis I could conduct other investigations exposing the same weight pieces but different surface areas. This way I can see how the surface area of a potato affects the amount of osmosis that takes place. I could use the results obtained from this experiment to compare the differences and similarities of the end results of both investigations. I could also use a larger variety of concentrations; this would make the estimation of concentrations in between those tested in this investigation much more accurate.
Another way of investigating osmosis further would be by seeing the effect of concentration on different types of potatoes e.g. red or baked etc. or using entirely different plants (e.g. plants, other vegetables, fruits or a different type of potato). This would test how different semi-permeable membranes could affect osmosis and the movement of water out and into organisms.
I could also conduct an investigation into how osmosis is affected when it occurs it different conditions, i.e. how osmosis occurs under a high or low temperature. I could also further investigate this field by seeing how much heat a semi-permeable membrane can withstand before it disrupts. Moreover, I could then do another investigation to see how exposing the potato to heat beforehand affects osmosis.
Bibliography
– For Definitions and Information
http://www.zenon.com/image/resources/glossary/reverse_osmosis/normal_osmosis.jpg
http://dwb.unl.edu/Teacher/NSF/C11/C11Links/www.fordham.edu/Biochem_3521/lect14/dissacharides.GIF
http://www.purchon.com/biology/osmosis.htm