To make this test fair, only 1 factor should be varied, which is length. Importantly;
- The surrounding room temperature should stay the same otherwise the particles in the wire will move faster (if the temperature is increased and also more electrons are freed so more current flows ) and this will therefore have an effect on the resistance. This would give out a unfair set of results.
- The material of the wire must also be kept the same as different materials have different conductivity
Safety
This experiment as such is not too dangerous, but precautions must be taken. The electricity must be handled with care and no water should go near the experiment. The experiment must not be carried out if hands are wet. The wire shouldn’t be touched as it can get hot during the experiment.
Preliminary results
Before I chose my resistance wire, I took some preliminary results to find out the wire with the highest resistance. As the higher the resistance is, the more accurate I can measure it. I chose 3 materials, copper, nickel chrome and constantan. I took the following swg numbers, 22, 26, 30, 34 and 36. I used a multimeter to find the resistance. Here are my results. (in ohms)
I chose the Nickel chrome wire with a swg of 36 as this gave me the highest resistance. This gave the highest resistance because nickel chrome was more resistant and also it was the thinnest so there was less room for the electrons (in the electricity) to move through so there were more collisions and therefore a higher resistance.
OBSERVATIONS
Table
I saw that for the last result (10cm) the voltage was much lower and the current much higher, this was probably because the wire started to get hot. But because this was the case for P.D 1,2,3 and I 1,2,3. I decided to keep them as they were and work out the average resistance. This result didn’t make much difference as you can see the average resistance has a pattern and the 10.0 cm reading follows that pattern (ie the resistance increases by between 4-5 ohms between every length). Also instead of starting with 10cm and working up to 100cm, I started with 100cm and cut it by 10cm everytime, this was so that material was not wasted.
Last of all the lengths were taken to the nearest TO 1 d.p to make the results more accurate.
Graph
Analysis
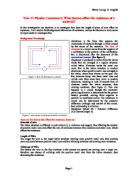
From my results I found out that as the length of the resistance wire decreased the resistance also decreased this is This is because the electrons in the current collide with the particles in the material. The longer the wire the more the particles in it so more collisions are made the longer the wire so therefore resistance is higher.
From my graph, I found out that there was a positive correlation and that resistance increased as length increased. Also the increase is constant. This is indicating by the fact that the line drawn is a straight one/
I also found out many patterns from my results table. I saw that the average resistance table, the resistance between lengths was mostly an increase of 4-5 ohms. So this told me the results were quite reliable and there was a regular pattern. My graph confirmed this as all the points were on or very near the line of best fit.
I noticed that on the reading of 10cm, the voltage was much lower and the current much higher, this was probably because the wire started to get hot and so the resistance was higher as more of the current was dissipated.
CONCLUSION
From, the evidence collected it is clear that as the length of resistance wire increases, so does resistance. This is because the electrons in the current collide with the particles in the material. The longer the material the more the particles in it so more collisions are made (the longer the material) so therefore resistance must be higher. This conclusion is valid because the evidence collected was carefully carried out and the results show it was reliable, especially the graph. The conclusion fully supports the prediction made. As in the prediction, resistance increased as length increased. The prediction is fully justified and correct, based on the evidence collected.
EVALUATION
I was very pleased with my experiment as the results which I gathered were very reliable. The evidence collected was made further accurate and reliable as results were taken accurately to either 1 D.P or 2 D.P. Also using the formula voltage/current (rather than using a multimeter). Made the resistance totals much more reliable. The graph confirmed this reliability as the line was straight and all the points, (with maybe the exception of the last point) were on our near the line.
From my experiment, I didn’t find any anomalies. I had a thought about a result (highlighted in the table) but this seemed to be reasonably accurate and didn’t make a big difference at all.
My experiment was accurate and very well put together, only minor improvements could have been made. The only suggestions I have is to put either;
- A variable resistor in, to control the voltage as the wire got hot as the current went over 0.6 amperes.
- Or I could have used a multimeter to measure resistance but I would have to subtract resistance in the connecting wires and it might not have been as accurate as the v/I method.
It was also difficult to keep the wire straight and cut exactly 10cm off. I managed to do it very accurately but it was time consuming. But all the wires were kept straight during the experiment. Nether the less these are only minor improvements which would only make the results slightly more accurate and wouldn’t change the conclusion gathered, that resistance increased as the length of wire increased.
The evidence collected was very reliable as it supported both the conclusion made and my prediction. There were no major anomalies to disrupt the evidence collected so it was very reliable (confirmed by graph). I was very happy with my findings.