+ 1% Urease – 20cm3
Total – 100cm3
In 80cm3 of 2M Urea,
No. of moles = 2 x 80/1000 = 0.16
Therefore, max. amount of ammonia made = 0.32 moles
Titration/
NH3 (aq) + HCl (aq) → NH4Cl (aq) + H2O (l)
Therefore, we need 0.32m of HCl.
Therefore, in 100cm3 acid we need 0.32 mol.
C = n/v = 0.32/ 100/1000
Therefore, we need to use HCl of 3.2 molar concentration.
Equipment & Chemicals:
5+ Beakers
Urease powder
Urea powder
Hydrochloric acid
Sodium Carbonate powder
Equipment for possible titration
Distilled Water
Bunsen Burner
Gauze
Tripod
Conical flask
Volumetric flask
Measuring cylinder
Pipette
Teat pipette
Electronic Weighing Scales
Safety Goggles
White tile
Methyl Orange Indicator
Stop watch
Preliminary Work 1
Aim:
To have an insight into roughly how much Sodium Carbonate titrated into a conical flask containing the urea-urease reaction before it turns neutral and to investigate whether I am using suitable concentrations of urea and urease.
Method:
I set up the apparatus needed for a titration experiment as shown in the diagram below:
Using a measuring cylinder and teat pipette I accurately measured out 80cm3 of 2 Molar Urea solution and 20cm3 of 1% Urease solution from my already made up standard solutions. The Urease solution had to made up fresh as it apparently becomes inactive after 2-3 days, so I didn’t want to srisk it.
Before the experiment starts, run the acid through the burette to remove any air bubbles. This acid will then be run out of the burette and replaced, ready to begin the actual titration. Also before beginning the titration the Burette must be cleaned by passing Hydrochloric acid through it; this is so that any chemicals from previous experiments are not still in the burette. Once the burette has been washed then it must be filled up with 1 Molar Hydrochloric acid by using a glass funnel to the 0 cm3 mark. To increase accuracy the bottom of the meniscus of the acid must be touching the line indicating 0 cm3. This can be achieved by positioning your eyes level with the bottom of the meniscus.
Pour the 80cm3 of 2M Urea solution and the 20cm3 of the 1% Urease into a 100ml beaker, starting the stopwatch as soon as both reactants have been added. Every six minutes I pipetted out 20cm3 of the solution into a 100ml conical flask. I added a few drops of methyl orange indicator into the conical flask. This turned the solution orange. I kept my hand on the tap and only turned it on slightly as I didn’t know exactly how much Hydrochloric acid would need to be added to neutralise the reaction, whilst also swirling the conical flask. When the solution turned completely from orange to pink I knew that the solution had been completely neutralised. At this point I turned off the tap on the burette and recorded the volume of acid titrated. The experiment was carried out at room temperature.
Conclusion to Preliminary
The reaction was far too fast and was really over within the first few minutes. Therefore, it makes it very difficult to measure the rate of the reaction. I also became clear to me that 30 minutes for each concentration and temperature was too long and therefore I need to carry out each experiment for only five minutes, taking samples of the reaction every minute. I will have to use smaller concentrations of both urea and urease to prolong the reaction.
Method of actual Experimental Procedure
Before the experiment starts, run the acid through the burette to remove any air bubbles. This acid will then be run out of the burette and replaced, ready to begin the actual titration. Also before beginning the titration the Burette must be cleaned by passing Hydrochloric acid through it; this is so that any chemicals from previous experiments are not still in the burette. Once the burette has been washed then it must be filled up with Sodium Carbonate by using a funnel to the 0 cm3 mark. To increase accuracy the bottom of the meniscus of the acid must be touching the line indicating 0 cm3.
Once I prepared my standard solutions, I began setting up my apparatus as shown in the diagram above. However, this time I only made up a 1 Molar solution of Urea and diluted it down to make my other concentrations. Using two measuring cylinders I measured out exactly 80cm3 of 1M Urea solution and 20cm3 of the 1% Urea solution. I also prepared a conical flask with 50cm3 of 1M Hydrochloric acid (that was chilled after being left overnight each night in a fridge) and a burette containing the Sodium Carbonate solution that will be titrated into the conical flask later in the experiment. I then poured both solutions, one by one, into a 150ml beaker and started the stop watch as soon as both reactants were added. I decided to use a bulb pipette to pipette out 10ml of the reaction into the conical flask containing the Hydrochloric acid solution. At the exact moment that the 10ml of the reaction was added, I also added a few drops of methyl orange indicator. The solution now turned orange. I turned on the tap on the burette and the Sodium Carbonate began to run into the flask. When the solution showed a hint of colour change, I slowly closed the tap on the burette and read off the value of the amount of Sodium Carbonate added. According to my research the solution should change colour from orange to pink. I repeated each experiment for each concentration of urea and urease three times over or until two results are within 5% of each other. Any anomalies will be noted. I will carry out the same procedure for every urea and urease concentration but it must be noted that when varying the urea concentration, the urease concentration will be kept constant throughout and vice versa.
Varying the temperature of the reaction
The set up of the apparatus was identical to the previous experiment. I have decided to react my 0.25M concentration of Urea with my 1% solution of Urease. The five different temperatures I will be using are: 10ºC, 20ºC (room temp.), 30ºC, 40ºC and 50ºC. The temperature should be raised by heating or cooled by adding ice. I carried out the exact same procedure as stated above (pages 8/9) with the exception that, for example, for the 50ºC experiment, I heated my 20cm3 of 1% Urease solution using a Bunsen Burner but turned it off as it reached around 45ºC, knowing that it would continue to rise anyway. Therefore, it is fair to say that the exact temperature would have been roughly +/- 2ºC of this value. I then placed the heated solution into a beaker containing my measured 80cm3 of Urea. I immediately started the stopwatch when both reactants reacted. Once again every minute I took a sample of 10ml of this solution using a bulb pipette and placed it in a conical flask containing my 50ml of 1M Hydrochloric acid. I will then add a few drops of methyl orange indicator to the solution. Finally, I will titrate my 0.5M solution of Sodium Carbonate and will turn the tap off the burette at the first sign of colour change. The volume of alkali added will be recorded. I will each temperature three times over. I will carry out the same procedure for each experiment, except for the 10ºC, as I will have to add ice to the urease solution to cool it down.
Diagram of Experimental Procedure
Prediction:
I predict that as both the temperature and the concentration increase then so does the rate of the reaction increase.
As the temperature increases, molecules have more kinetic energy (vibrate more often per second) with which to react. They collide more often and are more likely to collide with enough energy to overcome the activation energy needed. This is the energy that is needed to start breaking the bonds in the colliding molecules so that the collision can lead to a reaction. Figure 4 in Chemical Ideas page 224 shows that when you increase the temperature by 10ºC, from 300K to 310K.
E.g. The activation enthalpy of a reaction is +50kJ mol-1.
Figure 5 (Chemical Ideas, pg. 225) shows the number of collisions with energy greater than 50kJ mol-1, for the reaction at 300K. It’s given by the shaded area underneath the curve.
However, the optimum temperature at which most enzymes work is approximately 40ºC or roughly body temperature and I believe this to be true for Urease also. From my background knowledge though, I know
that as the temperature increases above 50ºC, then the enzyme begins to denature. This involves the enzyme’s active site changing shape/ becoming distorted. The substrate is no longer able to fit in the enzyme’s active site and the enzyme-substrate complex is no longer achieved.
In this investigation, both the urea and urease concentrations will be varied. Firstly, from my own reading I know that as the urea (substrate) concentration increases, the rate also increases because there will be more substrate molecules to collide with the urease molecules (enzyme), therefore increasing the possibility/chance of a successful collision.
At higher substrate concentrations, enzyme molecules become more saturated with substrate molecules, so there are fewer free enzyme molecules, which are available to combine with substrate molecules. This is why I predict that a graph plotting the rate of a reaction versus substrate concentration will flatten off at a certain level, which is unknown to me. At this point, the reaction remains at the saturation level.
Secondly, as the enzyme concentration increases then the rate of the reaction also increases. The increase in enzyme concentrations means that there are more active sites available to react with the substrate molecules. Initially, again from my research and outside reading, I predict that initially the graph-plotting rate versus enzyme concentration will be linear, before eventually beginning to level off. This is because as the enzyme concentration increases, there are more enzyme molecules available to catalyse the reaction. At very high enzyme concentrations, the substrate concentration becomes rate limiting, thereby the reaction begins to level off and therefore slows down.
Choosing the right Indicator
There are a large variety of indicators to choose from in this investigation. However, different indicators change colour at different pH ranges. The following are possible indicators to be used:
In this investigation, the standard solution of Sodium Carbonate that I made up had a pH of approximately 11.6 (according to my research on the internet). This was titrated to neutralise the Hydrochloric acid in the conical flask, which had a pH of approximately 2. The Methyl Orange indicator will turn the solution orange, which in turn should turn pink as the solution begins to be neutralised.
Safety
When handling the chemicals, eye protection, safety goggles and a lab coat must be worn especially when handling hydrochloric acid. Hazardous safety symbols must be placed on the solution/powder(s) to warn users of the dangers when handling the chemicals. These precautions must be kept worn until the experiment has been completed and the benches have been wiped down in case of spillages and sprinkles.
↑
Throughout the entire experiment, these precautions must be worn until the entire experiment each day is complete.
Risk Assessment
Urease
If in contact with eyes, flush eyes with water for at least 15 minutes and seek medical attention. In case of contact with the skin, immediately flush with plenty of water. If ingested seek medical attention immediately. Should be treated as potentially hazardous.
Urea
Contact may cause eye irritation including stinging, watering and redness. Contact with the skin may cause redness, itching and pain. Urea powder may cause irritation of the nose, throat and respiratory tract. These hazards do not really apply to the weak solutions of urea that I will be using.
Sodium Carbonate
Eye contact may produce notable irritation. Upon contact with the eyes, allow the normal tearing action of the eye to flush the material from the eyes. Due to the hyponicity of the solution, prolonged skin contact can wash away oils, leaving the skin dry and prone to cracking. In the event of ingestion, recommend that the person drink at least eight ounces of water to wash out the urea. These hazards are unlikely given the weak solution of Sodium Carbonate that I will be using.
Hydrochloric acid
Hydrochloric acid is highly corrosive. In case of contact, it rapidly causes burns of the mucous membranes, the eyes and the skin. Contact with the eyes, should be rinsed immediately under cold water and followed by treatment from a doctor.
↑
These symbols must be placed in the laboratory at all times to warn of the potential dangers when handling the chemicals in my investigation
How will I produce accurate and reliable results?
As an enzyme, Urease becomes inactive after roughly 2-3 days. To overcome this problem I will make up a fresh, new solution of urease each day. When investigating the effect of temperature on Urease’s activity, I will store my Urease sample in the fridge every morning before varying the temperature.
It is very difficult to stop the Urea-Urease mixture from reacting in the flask when beginning the titration. However, this should be overcome by the use of a buffer solution, which in this case will be Hydrochloric acid.
I will replace/wash each beaker, conical flask and burette after every experiment. This prevents any chemicals from mixing/reacting and will also alter the volumes of each reactant that has been added, which could affect the rate of reaction.
I will repeat each temperature and concentration twice for each investigation or even possibly a third time depending on whether the two results are within 5% of each other. I am also using a wide range of concentrations and temperatures to vary (exactly five temperatures and five concentrations). This will ensure that my results are comparable and therefore reliable, especially given that I will be repeating my results.
-Having a white tile underneath the flask will make it clearer to see when the solution changes colour.
-Read accurately the readings from the burette and avoid rounding to be accurate.
-When measuring the volume in the volumetric flask, make sure that the flask is placed on a level surface and that your eye level is in line with the graduation mark on the flask.
Finding the order of the reaction:
Changing the concentration of substances taking part in a reaction usually changes the rate of the reaction. A rate equation shows this effect mathematically. Orders of reaction are a part of the rate equation.
For a general equation in which A and B are the reactants:
A + B → products
the general rate equation is:
Rate = k [A]m [B]n
m and n are the powers to which the concentration needs to be raised: they usually have values of 0, 1 and 2. m and n are called the order of the reaction, with respect to A and B.
e.g. rate = k [H2O2] [Catalase]
In this case ‘m’ and ‘n’ are both equal to 1. We say the reaction is first order with respect to H2O2 and first order with respect to catalase. The overall order of the reaction is given by (m+n), so in this case the reaction is overall second order.
NB/ Only one concentration should be varied at any one time and the temperature must be kept constant throughout.
In this experiment,
Temperature and rate constants
Rate = k [A]m[B]n
If the temperature increases by 10ºC then the rate of many reactions is roughly doubled. Since the concentrations are not changed, the rate equation
Rate = k [A]m[B]n
Shows that it must be the value of k, the rate constant, which has doubled.
Generalising this
By doing experiments involving a reaction between A and B, you would find that the rate of the reaction was related to the concentrations of A and B in this way:
This is called the rate equation for the reaction.
The concentrations of A and B have to be raised to some power to show how they affect the rate of the reaction. These powers are called the orders of reaction with respect to A and B.
For UK A' level purposes, the orders of reaction you are likely to meet will be 0, 1 or 2. But other values are possible including fractional ones like 1.53, for example.
If the order of reaction with respect to A is 0 (zero), this means that the concentration of A doesn't affect the rate of reaction. Mathematically, any number raised to the power of zero (x0) is equal to 1. That means that that particular term disappears from the rate equation.
The overall order of the reaction is found by adding up the individual orders. For example, if the reaction is first order with respect to both A and B (a = 1 and b = 1), the overall order is 2. We call this an overall second order reaction.
Some examples
Each of these examples involves a reaction between A and B, and each rate equation comes from doing some experiments to find out how the concentrations of A and B affect the rate of reaction.
Example 1:
In this case, the order of reaction with respect to both A and B is 1. The overall order of reaction is 2 - found by adding up the individual orders.
Activation enthalpy
Activation enthalpy is the minimum kinetic energy required by a pair of colliding particles before a reaction will occur. It is the energy that must be supplied to enable bonds in the reactants to stretch and break as new bonds form in the product.
Analysis
From all the results I have gathered, I can give the judgement that the prediction I made was accurate and correct. As the concentration of both the enzyme and the substrate increase, then so does the rate of reaction increase. The same can be said for increasing the temperature. However, both these statements are not as straightforward as they may seem. From my graph(s), I can see that the rate of reaction was fastest at around 40ºC. This is Urease’s optimum activity temperature. As I mentioned in my background knowledge, as the temperature rises the enzyme and substrate molecules move faster. They collide more often and with more energy and are therefore more likely to collide with enough energy to overcome the activation enthalpy. Beyond 40ºC, then the reaction begins to slow down. The enzyme molecules begin to change shape in heated conditions. Their active sites are affected and the enzyme is said to be denatured. My results and graphs also indicate that as the enzyme concentration increases there are more active sites available to react with the substrate molecules. However, once the enzyme concentration reaches a certain level, then the rate no longer increases and begins to level off, as the substrate concentration becomes a limiting factor.
As substrate concentration increases, the initial rate of reaction also increases. There are more substrate molecules to collide with the enzyme molecules, therefore increasing the likelihood of a successful collision. However, as the enzyme molecules begin to become fully saturated with substrate molecules then the reaction begins to slow down. This stage is known as the saturation level of an enzyme-catalysed reaction.
However, it must be noted that some of graphs produced perverse trends.
E.G. my graph to investigate the trend produced by varying the temperature of an enzyme-controlled reaction produced the following trend:
This scatter graph has produced the inverse trend to the ‘hill-top’ that I had expected and researched in my reading on the factors that affect enzyme-catalysed reactions. There is, however, an explanation as to why this has occurred. This graph has plotted temperature against the volume of Sodium Carbonate titrated into the conical flask.
If, however, I plot the temperature versus the amount of Sodium Carbonate that remained in the burette after the titration (Vo-VT), then the trend/pattern of my graph is very similar to the prediction I made.
Results Tables
First order
Results at room temperature, varying concentration of urea
0.1M Urea
0.25M Urea
0.4M Urea
0.6M Urea
1.0M Urea
1M Urea – Varying Urease
1% Urease
0.7% Urease
0.5% Urease
0.2% Urease
0.1% Urease
Bibliography
www.btinternet.com/~chemistry.diagrams/ titration.htm –This website provided me with the diagram of the set-up of the apparatus.
www.geog.soton.ac.uk/school/safety/ prepared/palaeo/fusion.rtf – I used this site to help in my risk assessment. It helped me to be aware of some of the potential hazards that can occur whilst carrying out the experiment. This information allowed me to take the necessary safety precautions.
was used to examine the possible hazards when dealing with Hydrochloric acid. However, we will only be using a weak concentration of the acid, so the hazards will be minimised.
Chemical ideas book on pages 12-13 gave me an insight to working out the concentrations and how to go about the experiment.
Advancing Chemistry book provided me with a table of the possible choice of indicators to use. From the table I decided to use Methyl Orange.
- provided me with my background knowledge and some excellent graphs along with simple scientific knowledge.
Evaluation
There were many limitations to this experiment that I tried my best to overcome. Firstly, it was very hard to control the temperature at which the reactions were taking place at. When varying the temperatures, it dropped quickly and varied from start to finish. In reality there was very little I could do to overcome this problem, which may have slightly affected the rate of the reactions. I did record the temperature at 0 and 5 minutes and the difference was never greater than 3.5ºC. Another limitation related to temperature was the fact that the room temperature varied each day. It is difficult to know the extent of the affect this had on my results. I recorded the room temperature every day for two weeks and the range varied by 0.6ºC but there was little else I could have done otherwise. Getting my Sodium Carbonate powder to dissolve was arguably the hardest challenge in the experiment. The process took a very long time and in reality I noticed a few, tiny bits of powder in the bottle of the solution. I used a magnetic stirrer for almost half an hour, combined with intensive stirring using a glass stirrer, to try to overcome this problem. From my research, I knew that my Urease solution became inactive after 1-2 days. This meant that everyday I had to make up a new solution of Urease to avoid this problem. Another problem I experienced throughout the whole investigation was knowing when exactly the indicator has changed colour. My eyesight would have varied throughout each experiment and therefore the exact moment when I turned the tap off the burette would have varied. This meant that at certain times I may have added too much or not enough Sodium Carbonate to fully neutralise the Hydrochloric acid in the flask. I also had a problem with transferring the mixture from the beaker into the conical flask. This meant that the reactants were still reacting in the pipette so a buffer solution of Hydrochloric acid was used. However, the exact effects of it are unknown to me, though research indicated it was effective in stopping the reaction from taking place in the flask. The final limitation in this investigation was that there was a 30 second gap before titration is underway while I sample from beaker to conical flask. I tried to overcome this by being quicker in pippetting out 10ml of the reaction.
It is very difficult to know how exactly I could have improved the reliability and accuracy of my results. I suppose that having more accurate apparatus on hand would have been helpful, but the extent to which my results would have become more accurate is unknown and unavailable to me. I could also have carried out more repeats for each concentration and temperature and also used more temperatures and concentrations to investigate. This would have improved the accuracy of results and graphs.
Having a control sample of the end point of the colour of the indicator beside each experiment would have helped me to identify exactly when to stop titrating in Sodium Carbonate into the flask. Arguably I may have turned the tap off at different points in each experiment therefore adding too much or too little Sodium Carbonate. Otherwise using a pH meter would have provided me with quantitative data e.g. a solution of pH 7.2, rather than qualitative data e.g. using your naked eye to decide approximately when the solution changed colour. Facts would have been more accurate than judgement.
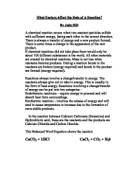
Another alternative procedure:
An aqueous solution of urea is stable at room temperature, but when the urease is added the pH of the solution goes up as ammonia is produced.
The experiment shows how you can measure the speed of the reaction quite accurately by titrating the ammonia, as it is produced, with acid so that the pH stays constant. The rate at which you add the acid gives you a measure of the rate of ammonia production.
Prepare a standard solution of urease. Filter the mixture into the conical flask, stopper it and keep the filtrate refrigerated between practical sessions. Using a pipette, transfer a certain volume of the known concentration of urea into a beaker. Set up the apparatus as shown in figure 9.
Stir the solution carefully using a magnetic stirrer. Adjust the pH of the mixture to 5 by the addition of drops of a known concentration of hydrochloric acid solution. Add a certain volume of urease solution using a graduated pipette. Shake the mixture and start the stop watch. Very carefully add the acid at a steady rate so that the pH remains at 5. Read the volume of acid added at regular intervals e.g. every 15 seconds. Stop taking readings after 5 minutes. Run a control experiment with distilled water in place of the urease.
The following calculations highlight the percentage inaccuracies of the apparatus that I used throughout the procedure:
= 0.8/1000 x 100 = 0.08%
= 0.2/250 x 100 = 0.08%
-
10cm3 – Error = +/- 0.024
= 0.024/10 x 100 = 0.24%
-
25cm3 – Error = +/- 0.024
= 0.024/25 x 100 = 0.24%
= 0.5/10 x 100 = 5%
= 0.5/20 x 100 = 2.5%
= 0.5/30 x 100 = 1.67%
= 0.5/40 x 100 = 1.25%
= 0.5/50 x 100 = 1%
- Burette
Therefore, the measurement that produced the highest percentage error and therefore the greatest inaccuracy is the 10ºC temperature value.
Using 1% Urease and 0.25M Urea
10ºC
20ºC
38ºC
50ºC
Activation enthalpy
Log of rate on y-axis
1/temp-x-axis – temperature in kelvin (273+temp.)