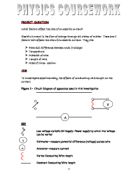
Ohm’s Law:
V = I x R
A simple and fair test is needed to investigate the effects of the conducting wire length on a current.
PRELIMINARY EXPERIMENT:
Preliminary work was carried out to help clarify the method of the experiment and make changes. It also helped to decide the range of observations and measurements to be made.
RESULTS
Table 1- Data collected in Preliminary experiment
Figure 5- Graph showing Preliminary results against what was expected
As shown in the graph, my preliminary results were not very accurate. The following changes had to be made to my method of procedure:
- Set needle of voltmeter accurately
- Measure the length of wire accurately
- Clean the contacts and put it in perfect position.
- Be careful to connect the positive (+) side of the ammeter to the positive side (+) of the power supply, which is colour coded otherwise the ammeter will not work
- Tape the wire down to keep it in place
- Wind wire around crocodile clip tightly, from near end of 0.1m otherwise each reading will have an extra 0.1m(shown below)
KEY
RULER
CONDUCTING WIRE LENGTH
CROCODILE CLIP
A suitable range of measurements was selected as 1m, 1/2m, 1/3m, 1/4m, 1/5m, 1/6m, 1/7m, 1/8m, 1/9m and 1/10m because the reciprocal of these values is 1,2,3,4,5,6,7,8,9 and 10. It provides a useful scale for plotting the graph and the data will not be clustered in one area.
So that the results are as accurate and reliable as possible the readings should be carried out 3 times and these result would be plotted to draw a line of best-fit graph. The average will also be calculated and shown on the graph
APPARATUS NEEDED:
1m20 Constantine Wire SWG (Standard Wire Grange) 38 – [Also known as eureka. Resistance does not change as temperature increases. Resistivity at room temperature is 49 x 10 (Muncaster, 1986 p487)]
Low Voltage Variable DC Supply
Voltmeter
Ammeter
1 metre rule
Tape
Wire cutter
Wires
Crocodile clips
METHOD
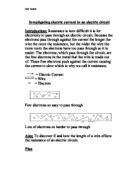
- Connect and set up equipment as in the Circuit diagram (Figure 1) Using
the wire cutter and ruler, measure 1m of Constantan Wire SWG 38 to
be the variable wire.
- Set the voltage to 1V using the variable DC Power Supply. Keep at 1V
throughout.
3a) Measure the size of the electric current by noting down the ammeter
reading.
3b) Be sure to connect the correct terminal of the ammeter to the
matching terminal of the power supply
- Vary the size of the wire to ½ of 1m and take the ammeter reading.
- Vary the wire length to 1/3, ¼, 1/5, 1/6, 1/7, 1/8, 1/9 & 1/10 of the
original value
- Repeat this 3 times and take the average as the result to make the
experiment as fair as possible.
- To make it a fair and accurate test, the wire length must be the only variable. All other factors must be kept constant. The cross-sectional area and material of wire must stay the same so Constantan SWG 38 will be used throughout. The results must be all taken on the same day so that the atmospheric temperature is the same. The needle of the voltmeter should be set perfectly at 1V.
SAFETY: It is very important and the following precautions must be carried out to prevent any accidents:
- Working area should be dry and clean
- Move bags and coats away
- Keep bare hot wire away from paper; could ignite
- When wire length is at its shortest be careful when touch wire as it might be hot.
SOURCES OF INFORMATION:
- Mr Allnutt
- Science Club
- “A-Level Physics Second Edition“ Text Book by Roger Muncaster
- CGP Physics Revision Guide for GCSE Double Science.
ANALYSING EVIDENCE AND DRAWING CONCLUSIONS
From Table 2 it can be seen that as predicted the longer the length of the conducting wire, the smaller the current is as it has a lower value in amps. As the wire length gets shorter the current appears to increase proportionally as predicted.
When the length of the wire is 1m the average (mean) current is 0.033A
When the length of the wire is 0.1m the average (mean) current is 0.350A
The 0.1m wire is 1/10 of the length of the 1m wire and so its current should also be 10 times the current of the 1m wire.
10 x 0.033 = 0.330A
My experimental value is 0.350A
My experimental value of the current at 0.1m appears to be just a little more than 10 times the current of the 1m wire.
When the length of the wire is 1m the average (mean) current is 0.033A
When the length of the wire is 0.5m the average (mean) current is 0.069A
The 0.5m wire is 1/2 of the length of the 1m wire and so its current should also be 2 times the current of the 1m wire.
2 x 0.033 = 0.066A
My experimental value is 0.069A
My experimental value of the current at 0.1m appears to be just a little more than 2 times the current of the 1m wire.
Both calculations show that as predicted the wire length and current are indirectly proportional. It also shows the accuracy of my results as the experimental and theoretical current values are very close together. The small gap between they allows for little experimental error
I = k X 1
L
I α 1
L
The graph in Figure 6 also shows the current as inversely proportional to the length of the wire. This is represented by the straight line of best fit that passes through nearly all of the average current values, showing a clear relationship between the two. For the x-axis I used 1/Length instead of just Length to spread the data otherwise most points would be grouped below 0.5m. The data collected has been plotted on the same graph as the mean current values to show the how accurate the mean is to the actual data and vice versa. On the graph the data are very close together and overlap each other and the mean. This shows no real anomalies. This shows that the data are very accurate as they are very close together and any finding or conclusion taken from them is fairly reliable.
However temperature did not affect the current as it was thought that it would when using the shorter wire lengths and remains constant throughout the experiment and does not interfere and affect the results.
The resistance in this experiment is important. As the voltage was constant, it is the increased resistance in the wire caused by the long wire length that causes the current to be reduced. The theoretical resistance was calculated to check if it was numerically close to my experimental resistance, which was calculated using Ohm’s Law (R= V/I) and the current recorded at the different lengths. The theoretical resistance would tell me if the current measured at the different stages was accurate and therefore prove the reliability of my results.
Table 3 shows the experimental resistance calculated using Ohm’s Law (V=IxR). Table 4 shows the theoretical resistance calculated using the resistivity, length and area of the Constantan 38 wire used each time. This calculated value shows what the resistance should have been each time.
When looking at the two resistance values they appear to be remarkably similar. Figure 7 shows this relationship as the two Resistance graph lines run parallel to each other. The parallel graph lines indicate that my data is accurate and therefore reliable enough to draw valid conclusions from. I then calculated the percentage accuracy of my results to see the level of constancy. These values are shown in Table 5.
Looking at the above figures all the experimentally based figures are 83-87% accurate, which I think, is good enough to support the original prediction that increased length results in increased resistance. This also shows a 13-17% difference due to experimental error. This error can be explained as a result of any constant irregular conditions or errors in throughout the experiment.
CONCLUSION
The length of a wire affects the size of the circuit’s current. As the length of the wire increases, the current decreases proportionally. When a long piece of wire is attached to a power supply, electrons encounter more ions and collide more often and so there is more resistance present in the wire. Each collision uses up more energy and so the electrons slow down resulting in a smaller current. As the current decreases as a result of the increase in length, the resistance increases, as supported by the calculated experimental and theoretical resistances.
EVALUATION
Overall I think that the experiment was very successful. I think that it was carried out at a reasonable standard of accuracy as I obtained a large quantity of data from which I was able to create informative graphs and draw precise conclusions. Also most of my results followed a similar pattern.
The graph in Figure 6 showed a clear visual relationship between the current and the wire length. Nearly all of the points were directly on the line of best fit or very close to it. Some results that did not fall on the line of best fit were:
- Anomalous 1- at 0.3m
- Anomalous 2- at 0.125m
All the results followed a consecutive pattern and Figure 7 showed that the experimental resistance was parallel and followed the same trend as the theoretical value. The difference between the two was due to experimental error as were the anomalous results in Figure 6. Errors in my experiment that could have been modified to make the experiment more accurate and the results more reliable were:
- For each wire length the same wire was used each time. For more accurate results a different piece of wire could have been used each time. However this is very wasteful and not very practical in a school situation where there is a limit as to the amount of wire you can use as the school have a budget to keep to and the materials need to be shared amongst all the students.
- The crocodile clips slipped at times during the experiment and so affected those readings. For more accurate results more accurate connectors could have been used.
- It was hard to set the voltage accurately as the needle of the voltmeter fluctuated and needed to be exactly parallel to the line that read 1V. To make it easier and more precise a voltmeter with a more magnified scale could have been used.
In general however I think that my results were fairly precise as my method to carry out this experiment was fairly accurate. As a result it was a reasonably fair test. Some of the positive aspects of my procedure that were the cause of the accurate results were:
- A large range of data was collected
- The surfaces of the contacts were cleaned before they were used so that there was a good connection.
- Changes made to the method after the preliminary experiment were good, and made a difference as the experiment was a lot fairer and so the results of the main experiment were more accurate than the results of the preliminary work carried out.
- The crocodile clip was attached to the wire the same way for each of the different wire lengths.
- As a result of the preliminary we were more familiar with the experiment and so were able to complete the experiment comfortably in the time given without rushing.
- Constantine wire was used which does not heat up as easily as other wires, and so temperature did not really affect my results
As an extension to this piece of work I could use other wires made from different material like Nichrome wire for example and investigate the pattern between the current and wire length using wires made from different materials. I could also use wires of different thicknesses and investigate how the current changes as the length does.
To further investigate factors that affect the size of an electric current I could look at experimentally, another factor that effects the current and compare my findings to this experiment. I think I would look at the cross-sectional area of the wire. It would provide me with more evidence about changing the size of an electric current.