Prediction
I predict that as the mass gets higher the mass will not travel as far. Due to there will be a lot more friction and when the elastic potential energy turns into kinetic energy the higher the friction the quicker that kinetic energy turns into heat energy. The friction slows the mass down because the force pushing it along has to overpower the friction. Where as the amount of Newton’s propelling the mass will be weaker in this experiment, so it will slow down quicker.
Method for the trial run
In my trial experiment I will use an elastic band hung between two pins 6cm apart then I will propel a mass across a board covered with sugar paper. Then I will measure how far it travels across the sugar paper increasing the mass each time by 10grams.
First of all I need to do a trial experiment to see if it will actually project across the surface.
Analysis of my trial run
Within my trial experiment I only went to 60grams but I could have a wider range of results in my real one by increasing the mass to a higher load. In my trial experiment I have also noticed that it has stuck to my prediction.
My real experiment
Method
- In my experiment I will use;
- An elastic band hung between two needles 6cm apart.
- I will then place a mass starting with 10g on the board and pull the mass and the elastic band back.
- I will then release the elastic band and the mass propelling the mass across the board.
- The board will be covered with sugar paper so that it is all the same surface making it a fair test.
- Then I will measure how far it travels across the sugar paper.
- Then start all over again but increasing the mass each time by 10grams.
Apparatus
Elastic band
- Two needles
- Ten, 10gram masses
- A long board about a meter long
- Sugar paper
- A meter stick
Results
From my table I have noticed two things within experiment 1 there is an anomalous result so something must have affected that result I will look into that in my evaluation though.
I have also noticed that experiment 1’s results are quite different to the others. I mean there readings are a lot lower quicker than any of the other experiments.
I can see from my table and my graph that my prediction was right the distance the mass travels gets lower the more mass added. I can see this from my graph by the steady curve downwards.
All though there was an anomalous result in experiment one this did not affect my graph and average distance too much.
Evaluation
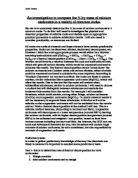
As I showed in my analysis there was one anomalous result. The result is in experiment one where at mass of 20grams 1st experiment says 16.1 the one below it at 30grams says 18.4 and the other two-experiment show that at 20grams the distance should really be around 19.4 or 21.6. I think this anomalous result was acquired due to these factors,
- Maybe the pull back was too short,
- The person was pressing down unevenly on the mass,
- Maybe there was a bump in the surface that slowed it down.
- These factors would need to be looked at harder if I ever do the experiment again.
The other thing that was odd within my results was how quick my results shot down in experiment 1 compared to the other two experiments. The factors that affected this could be that,
- We weren’t correctly pulling the mass back enough,
- Maybe we were pressing to hard on the mass,
- The most likely one is the fact that the person in experiment 1 pulling the mass back was a different person to the person pulling back in 2 and 3 due to he was taken from the class due to personal reasons.
In this experiment I could have also made my readings more reliable by doing them to a higher decimal place giving me more accurate readings.
I could have done to remove these errors:
- Giving each person a job to do with the experiment and making them stick to that assignment.
- Another way is to make sure that the surface is flat all over and no bumps.
- We could also use a ruler and make sure the mass touches it on pull back so that it is the same distance back every time.