Volume of water collected in the measuring cylinder:
Qualitative data:
Soil Sample A: Light brownish in colour, Coarse in texture compared to Soil sample B. Very grainy type of soil.
Soil Sample B: Dark brown in colour, Finer in texture in comparison to Soil sample A. Smooth type of soil.
Table No.3
Table No.4
Checking for normal distribution:
At first I will see if my data is normally distributed. I will do this by following method: the 68-95-99.7 rule. In a normal distribution 68% of the data lie within 1 standard deviation of the mean, 95% lie within 2 standard deviation, and 99.7% lie within 3 standard deviation.
The data is normally distributed and so I shall now perform a T test.
Null hypothesis: There is no significant difference between the two means.
Alternate Hypothesis: There exists a significant difference between the soil percolation rate of soil sample A and soil sample B.
Step 1: The difference between the means of the two sets of data.
Mean of Soil Sample B – Mean of Soil Sample A= 0.019111
Step 2: Square the Standard deviation of Soil Sample A set of data and divide by the number of pieces of data.
(0.011325)^2 =0.0001282
0.0001282/15=0.0000085
Step 3: Square the Standard deviation of Soil Sample B set of data and divide by the number of pieces of data.
(0.010956)^2 =0.0001201
0.0001201/15=0.000008
Step 4: Add the results from step 2 and step 3.
0.0000085+0.000008 =0.0000165
Step 5: Find the square root of the result from step 4.
= 0.004062
Step 6: (Difference in means)/ (Result from step 5)
0.019111/0.004062= 4.704825
T Value= 4.70
Degrees of freedom= 30-2= 28
Critical value for 28 degrees of freedom when P is 0.05 (calculated from table based on Zar) = 2.05
Since the T value is greater than the Critical value we can be 95% confident that the difference between the mean percolation rate between soil sample A and soil sample B is statistically significant. In this case the null hypothesis is rejected In favour of alternate hypothesis.
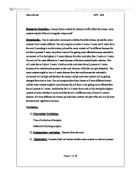
Graph comparing the mean soil percolation rate of the two soil samples.
X Axis: 1=Percolation rate of soil sample A 2=Percolation rate of soil sample B
Y Axis: Percolation rate
Error bars are of standard error.
Discussion
I believe that there is a difference between the percolation rates between the two soil samples as the Mean Percolation rate of Soil sample A is: 0.03ml/sec and Soil sample B is: 0.05ml/sec and there is a difference of 0.02 ml/sec . The T test showed that the difference between the two means is significant. The T value (4.70) was greater than the critical value (2.05).
The graph also showed the two means are different. Clearly the percolation rate of soil sample B was larger than the percolation rate of soil sample A.
The standard deviations of both the samples were almost the same (0.011325) for soil sample A and soil sample B (0.010956). Upon approximation to two places of decimal they are both the same (0.01)
Evaluation
The readings taken seem to be quite accurate as I got a normal distribution. Also my Standard deviation was low in both sets of data thereby suggesting that the error in taking repeated reading was low. The soil was left to dry and the percolation arte was calculated using the dried soil samples. The soil samples were left to dry in the open and we depended on evaporation as the method for drying the soil. Both soil samples were kept under same conditions of weather and humidity, in other words room temperature and environment were kept constant. Though the visually the soil samples looked dry there could have been a possibility that some moisture was still there. We could have slightly heated the soil samples before suing them for the experiment to make sure there was no moisture in them.
For every reading soil sample was taken and put into the funnel, We did not grind the clustered lumps soil before putting it into the funnel. Though this would simulate the natural condition of soil, there was a strong possibility that different samples would have different degrees of clustered soil lumps. This would create inaccuracies. One possible solution would be to grind the soil into a fine consistent form.
We could have identified the nature of the two soil samples that is clayey soil and sandy soil etc. then we could have referred to standard theoretical literature and got a clearer picture of percolation.
Conclusion
The mean percolation rate of Soil Sample B is higher than that of Soil Sample A.
The T test shows that the difference between the two means is statistically significant and this was NOT a chance occurrence. The null hypothesis was not accepted and the alternate hypothesis was accepted.
The graph No.1 justifies our conclusion. It tells us they the mean of Soil sample B is greater than the mean of Soil Sample A. The errors were kept to a minimum and we can safely conclude that there is a difference between the percolation rates of the two soil samples.