bio lab - The Effect of Temperature (C) on the Rate of Diffusion in seconds
The Effect of Temperature (°C) on the Rate of Diffusion in seconds
Question
How does increasing temperatures of water in degrees Celsius have on the rate of diffusion?
Hypothesis
Diffusion is the movement of molecules moving from a region of high concentration to a region of low concentration. If a drop of food colouring is dropped in increasing temperatures of water, then it will spread faster throughout the water because an increase in temperature means an increase in the molecules kinetic energy (Andrew, 344). The molecules will move faster and diffusion will occur faster in less time.
Variables
Independent: Different temperatures of water
Dependent: Rate of diffusion in seconds

Materials
5 X 200ml test tubes
Eye dropper
500ml beaker
Stop watch
Queens liquid green food colouring
Adtemp 419 hypothermia thermometer digital thermometer (±0.001 °C)
Cornea Pc-100 hot plate
100ml of ice cubes
Safety
Insulated gloves must be worn when dealing with boiling water and hot plate
Procedure
1) The amount of water was controlled by using a 500ml beaker to measure 100ml of water.
2) The 500ml beaker was put on the hot plate.
3) A digital thermometer (±0.001 °C) was used to check the temperature until it reached 100 °C (±0.001 °C).
4) When the temperature was 100 C° ...
This is a preview of the whole essay
Materials
5 X 200ml test tubes
Eye dropper
500ml beaker
Stop watch
Queens liquid green food colouring
Adtemp 419 hypothermia thermometer digital thermometer (±0.001 °C)
Cornea Pc-100 hot plate
100ml of ice cubes
Safety
Insulated gloves must be worn when dealing with boiling water and hot plate
Procedure
1) The amount of water was controlled by using a 500ml beaker to measure 100ml of water.
2) The 500ml beaker was put on the hot plate.
3) A digital thermometer (±0.001 °C) was used to check the temperature until it reached 100 °C (±0.001 °C).
4) When the temperature was 100 C° (±0.001 °C), the boiling water was poured in a 200ml test tube to keep the surface area controlled.
5) An eye dropper was then used to extract the green food colouring. Same brand was used for all trials to keep the concentration of the food colouring the same.
6) The amount of food colouring was controlled by dropping only one drop of food colouring in the test tube and as soon as the food colouring was dropped in the test tube, the stop watch was started.
7) The stop watch (±0.5s) was stopped when the food coloring dissolved and spread evenly throughout the water.
8) The time was recorded.
9) Steps 1 to 8 were repeated with water temperatures of 80°C, 60°C, 40°C, 20°C and 0°C
i) For 0C°, ice cubes were put in the 500ml beaker and steps from 2 to 8 were repeated.
10) After the first trial was done with various water temperatures, the second and third trials were carried out.
Raw data Table
Table 1: Rate of diffusion in seconds in water temperatures of 100°C, 80°C, 60°C, 40°C, 20,°C and 0°C
Sample Calculation
The following sample calculation was completed to find the average rate of diffusion in seconds (±0.5s) for water temperature of 100°C.
Formula:
Average = trial 1 + trial 2 + trial3
Total number of trials
= 127.4 + 130.7 + 126.8
3
= 384.9
3
= 128.3s (±0.5s)
Data Processing
Table 2: Average rate of diffusion in seconds in water temperatures of 100°C, 80°C, 60°C, 40°C, 20,°C and 0°C
The raw data table was processed into processed data by finding the average rate of diffusion in seconds. The processed data table is a better representation of the data because each trial for each water temperature had a different result. By finding the average it is easier to see the data and make assumptions based on it rather than looking at the raw data with many trials. The first differences were also calculated for the average to show the rate at which the points are decreasing.
Graph
The graph showed the average rate of diffusion in various temperatures of water. The relation between the average diffusion and temperature of water is a decreasing function. As the temperature of water increased, the rate of diffusion in seconds decreased.
Standard Deviation
The standard deviation was calculated for water temperature of 100°C.
Standard Deviation Formula:
1. The mean of the average rate of diffusion was found.
2. The calculated data for each trial was subtracted from the mean to obtain a list of deviations.
3. The differences were subtracted.
4. The squared differences were added.
5. The sum was divided by the total number of data values represented by ‘n’ values minus 1 (n-1)
6. The calculated data was square rooted to find the standard deviation.
Calculations
1. Mean = (127.4 + 130.7 + 126.8) / 3
=128.3
2. 127.4 – 128.3 = -0.9
130.7 – 128.3 = 2.4
126.8 – 128.3 = -1.5
3. (-0.9)2 = 0.81
(2.4) 2 = 5.76
(-1.5) 2 = 2.25
4. Sum of the squared differences = 0.81 + 5.76 + 2.25
= 8.82
5. n – 1
= 3 – 1
= 2 8.82/2 = 4.41
6. Standard deviation = Square root of 4.41
= 2.1
The standard deviation was rounded according to the average rate of diffusion calculated. There is a value of 1 significant digit out of the values of 127.4, 130.7 and 126.8, so the standard deviation will be rounded to 1 significant digit. The standard deviation for water temperature of 100°C is 2.
Conclusion
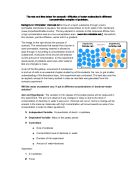
The aim of this experiment was to assess the effects of various temperatures of water on the rate of diffusion. The hypothesis was proven to be correct. When the food colour was dropped in increasing temperatures of water, the rate of diffusing decreased. When the water temperature increases, the molecules kinetic energy also increases, causing them to move from region of high concentration to a region of low concentration faster in less time. (Andrew, 344) This lab also helped explain the importance of diffusion in living cells. Diffusion is essential in cells for bringing inside nutrients. When cells lack something, they have a lower concentration inside, compared to the outside surrounding. So by diffusion, the missing nutrients flow inside from high region of concentration to the inside of the cell that has a low region of concentration (Campbell, 2005).
Limitations and suggestions for improvements
Works Citied
1. Campbell, Neil A., and Jane B. Reece. Biology. San Francisco: Pearson, Benjamin, Cummings, 2005. Print.
2. Ruth Richardes. “Movement of Materials across Cell Membrane." .
3. Campbell, Andrew A, and David M. Biology Course Companion. Oxford University Pres. New York, 2006. Print