DATA COLLECTION AND PROCESSING:
Raw Data Table:
Table 1. Data collected while observing how much of oxygen was evolved while agitating the vial with substrate concentration. Class was divided into groups and this is the data for my group.
Table 2. Data collected while observing how much of oxygen was evolved while agitating the vial with substrate concentration.
Table 3. Data collected while observing how much of oxygen was evolved while agitating the vial with substrate concentration.
Table 4. Data collected while observing how much of oxygen was evolved while agitating the vial with substrate concentration.
Qualitative Description:
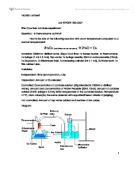
Hydrogen peroxide is a clear, transparent, slightly lustrous, and non viscous liquid.
Catalase (chicken liver) is an opaque, not lustrous, viscous, orange and reddish liquid. It also separated into two parts when it was heated. It also had a nasty smell.
While performing the lab with water with five different temperatures, the catalase in the beaker changed due to temperature. When the catalse was in the hot water, it divided into two, causing red to be on the bottom and brownish orange at the top. All the water in the beaker didn’t have change in the outward but the temperature change due to the ice cube and the hot plate.
Generally, when the two discs made contact with the substrate concentration, it reacted slowly and created small amount of bubbles. These were the oxygen and this was released into the graduated cylinder. Water which was at the room temperature released the most amount of oxygen because it had highest displacement of water. The one with the lowest amount of oxygen was the water which was at 45°C.
Data Processing:
Overview:
The raw data which was collected while processing the experiment with factor as temperature were represented in a table format. The assay was to use. Since tables are very useful when presenting two dimensions of information or viewing the data in an easier way, the raw data was presented in a table format. The raw data was also represented in error bar to examine how much error could have been made while processing the experiment.
Sample Calculation:
Standard Deviation:
1st trial for 5°C
S2 = Σ(- x1)2
n-1
S2= [(15-14.4) 2+(17-14.4) 2+(14-14.4) 2+(16-14.4) 2+(10-14.4) 2]
5-1
= 29.3
4
= 7.3
S =
S = 2.70185
T-Test:
T = (1-2)
= (21-8.6)
= 12.4
= 12.4
= 2.152897405
= 2.15
Degree of freedom = 8
T-test = 2.15
Probability value = 0.025
Presentation:
Figure 1. The bar graph represents the average of the volume of oxygen evolved for temperature with standard deviation.
Figure 2. The bar graph represents the average of the volume of oxygen evolved for pH.
Figure 3. The bar graph represents the average of the volume of oxygen evolved for substrate concentration.
Figure 4. The bar graph represents the average of the volume of oxygen evolved for catalase.
CONCLUSION & EVALUATION:
Conclusion:
Based on the data obtained from the experiment, my hypothesis was wrong. Before the experiment, my prediction was that as the temperature of the catalase increases, the rate of catalase activity will process faster and as the temperature decreases, the rate of the activity will process slower. I also thought that the rate of catalase activity for catalase at room temperature would stay neutral, meaning the median of rate between highest and the lowest temperature.
However, after the experiment, the data refuted my hypothesis. As the temperature increased, the amount of volume of oxygen evolved began to increase but started decreasing when the temperature passed the room temperature. This means that the rate of catalase activity increased as the temperature increased till the optimum temperature which is at 40°C usually but 23°C for this experiment. This is because, as the temperature increases, faster molecular action causes the collisions between substrate and active site to happen more frequently. The rate of catalase activity started to decrease after the room temperature because enzymes get denatured and malfunction at high temperature. At higher temperature, the vibration is produced inside enzymes due to heat. This breaks the essential bonds to maintain the structure of the enzymes. Therefore, as the temperature rises, there is both increase and decrease in enzyme activity. From the graph (figure 1.), the enzyme activity increased until room temperature and when the temperature was higher than the room temperature, it started to decrease. The room temperature, 23°C is an optimum temperature for this experiment because it was the turning point when the rate of enzyme reactivity started to decrease. Therefore my hypothesis was partially right at the part that when the temperature increases, the enzyme reactivity increases. However, it’s not completely correct because the enzyme activity starts to decrease at optimum temperature which is 40°C in usual case but 23°C for this experiment.
Limitation and Evaluation:
In overall, the experiment was successful because we were able to find the amount of volume of oxygen evolved during the experiment and find how temperature affected the rate of enzyme activity. However, it might have not worked well because of the errors we could’ve made. Some of the things which worked well were putting the soaked discs into the vial without making contact with the substrate concentration. While putting the soaked discs into the vial, it was hard for us to put them into without making a contact with substrate concentration because the discs were not very sticky and started to fall. However, our group members and I were able to prevent the discs from falling by soaking more enzymes to make them stickier.
There were lots of errors and possible errors which were made during the experiment. Some of the errors which were made during the experiment were the tipping of pneumatic trough, inconsistent agitation while experimenting the temperature for 15°C and inaccurate time period for the agitation. During the experiment, one of our group members tipped over the pneumatic trough. All the water from pneumatic trough and graduated cylinder were spilled. The tube with rubber stopper was plugged out from the vial and this led us to start the experiment again. While our group was performing the experiment for the catalase at 15°C, we only agitated the vial for 5 times for 90 seconds. This might have caused some errors in the result because the agitation was inconsistent. Lastly, while we were performing the experiment, the clock stopped suddenly this made us miscount the time. This definitely caused an error because the time wasn’t consistent for all the experiment.
Some of the random error could have made due to the distraction from other people in class. For example, our group might have miscounted the time and this might have caused another time error for the result.
The errors which could have been made were indefinite amount of substrate concentration, unstable temperature, inconsistent size of the discs, misallocation of disc in the vial, angle of graduated cylinder, different amount of pressure on the graduated cylinder and the inconsistent amount of catalase. There was indefinite amount of substrate concentration which could have definitely caused an error. For our experiment, only 5 ml of hydrogen peroxide should be in the vial. However, for some trials, there were either more or less amount of hydrogen peroxide in the vial. Since the amount of substrate concentration wasn’t consistent throughout the experiment, this might have made some outlier. Unstable temperature is another possible error because water cooled down very easily. While we were performing the experiment, temperature of water changed drastically and this made us hard to get the exact temperature for the experiment. So there might have been some errors made due to imprecise temperature. The pressure on the graduated cylinder might have caused error on the amount of oxygen evolved under the cylinder. If the pressure was too hard, less oxygen was evolved. Since the pressure was inconsistent, the results which were obtained might not be precise. Different amount of catalse also could have affected the result because the amounts of catalse on the discs were drastically different throughout the experiment. Therefore, there were lots of possible errors which could have been made during this experiment.
Some of the things which did not work well were the time management. There were enough time given for the class to work on the lab but our group member took more than a class for this lab. The reason was the lab plan we had created before the lab. The agitation of the vial was 90 seconds long and this prevents us from proceeding with the experiment quickly. Another thing which we didn’t do very well were the lab planning. Even though we planned ahead of what were going to do, our group changed the lab plan several times. This held back us from continuing the lab and this made us waste our class time to work on the lab. From the error bar, standard of deviation shows that there were quite lots of variation around the mean. The result of the t-test was 2.15 and the probability value was 0.025. This means that differences in data are due to chance 2.5 % of the time. 2.5 % is less than a 5% possibility that the difference between means is due to chance. This means the experiment was quite precise since it had low probability of happening due to chance.
Suggestions for Improvement:
Some of the suggestion for improvement for this lab is to have wider range in temperature. For this lab, we had five different temperatures to compare the rate of enzyme activity. However, we couldn’t find out the rate of enzyme activity at drastic temperature. For next lab, we could get more beakers and set them up in wider range of temperature to see when the rate of enzyme activity stops completely. To find out the rate of enzyme activity at drastic temperature, we can set up the temperature of the water right before the melting point and boiling point. This will help us to find out how the rate of enzyme activity processes at wider range of temperature.
Work Cited
Ritter, Bob et al. Biology 11. Nelson Thomson Learning. 2002