Variables-
Controlled Variables-
- Constant Source of catalase (blended red potato).
- Constant amount of catalase (5 mL).
-
Constant amount of 𝐻2𝑂2 solution (15mL).
-
Temperature of 𝐻2𝑂2 solution kept constant (20 degrees Celsius/ 68 degrees Fahrenheit, controlled by always using room temperature solutions and regularly measuring with thermometer.)
- Temperature of catalase (1.5 degrees Celsius/ 37 degrees Fahrenheit, controlled by regularly using freshly chilled catalase source and measuring with thermometer.)
- Always cleaning and properly drying materials before each trial.
- Source of distilled water kept constant.
- Stirring kept at a constant rate with a clean stirring rod for each trial.
- Trials always performed in room temperature by taking temperature of the air before all trials (20 degrees Celsius/ 68 degrees Fahrenheit)
-
pH solution always poured into 𝐻2𝑂2 solution, from the brim of graduated cylinder.
-
Always use 3 mL of pH solution to alter the 15 mL of 𝐻2𝑂2 solution.
-
Blended catalase always poured into 𝐻2𝑂2 solution, also from brim of graduated cylinder.
- A graduated cylinder with a radius of 1 cm was always used for constant height of bubbles measurement.
Materials-
- Blended Red Potato (kept in cold, 0 degrees Celsius conditions to guarantee freshness, 200 mL)
- Three 50 mL graduated cylinders with a diameter of 2.6 cm.
- Ten 10 mL droppers
- Three stirring rods
- Timer
- Hydrogen Peroxide (300 mL)
- 30 mL of each of the pH solutions (2 pH, 4 pH, 8 pH, 10 pH)
- Ice Box for catalase source (Red Potato)
- 50 pH strips
- Ruler
- Waste Container
Procedure-
-
Measure of 15 mL of 𝐻2𝑂2 solution in a 50 mL graduated cylinder as this will be substrate for the decomposition.
-
Use a small piece of pH paper and tweezers; tilt the test tube slightly to test and verify the pH of the𝐻2𝑂2 solution is the correctly intended. The first trial should be using a𝐻2𝑂2 solution without any pH solution added, which has neutral pH of 6. Record results.
-
Place a thermometer in the graduated cylinder of the 𝐻2𝑂2 solution to ensure that it is at room temperature (20 degrees Celsius/ 68 degrees Fahrenheit)
-
Measure out 5 mL using a clean graduated cylinder of thoroughly blended Red Potato that had immediately been removed from the icebox. Place a thermometer in the cylinder to ensure the temperature is chilled at 1.5 degrees Celsius/ 37 degrees Fahrenheit. Set the time to one minute and from the brim of the gradated cylinder, slowly poor the 5 mL of the catalase source Red Potato into the 15 mL of 𝐻2𝑂2 solution and start the clock.
-
Using a clean stirring rod, gently stir the 𝐻2𝑂2 solution and red potato with a slow, constant pace for one minute.
-
Immediately use a ruler to measure the height of the white foam from the initial height of the solution before the reaction occurred, to the top of the foam after one minute that reaction occurred. ((If you are not adding any pH solution, measure from the 20 mL mark (15mL of 𝐻2𝑂2 solution, 5 mL of red potato). If you are altering the pH of the 𝐻2𝑂2 solution, measure from the 23 mL mark (15mL of 𝐻2𝑂2 solution, 5 mL of red potato, 3 mL of pH solution.)) Record Results.
- Dump solution in the waster container (NOT down the sink) and CLEAN the test tube (use test tube brushes)
-
To alter the 𝐻2𝑂2 solution, pour 3 mL of the desired pH solution (that is room temperature, ensured by using a thermometer prior) into the graduated cylinder of the initial 15 mL 𝐻2𝑂2 solution and thoroughly stir the mixture.
- Repeat steps 1-8 using 𝐻2𝑂2 solutions but changing the pH level to 2, 4, 6, 8 and 10. Perform 5 trials for each different level.
Raw Data-
Qualitative-
As the lab was being performed, qualitative observations included the most bubbles formed the quickest around the pH levels of 6 and 8, and the bubbles were very dense and thick. In lower and higher pH levels such as 2, 4 and 10, the reaction was not as immediate and the bubbles were slightly larger. When the catalase reaction occurred, the smell of Red Potato was slightly stronger.
Quantitative-
With the Raw Data giver above, the pH of the 𝐻-2.𝑂-2 can be graphed against the height of the foam in order to establish a relationship between the variables. However the ensure accuracy from the multiple trials, each trial of the height of the foam will be averaged and given uncertainty.
Sample Average Calculation- (sum of data points divided by number of trials)
Sample Uncertainty Calculation- ((1/2 the range)
,,
Average and uncertainty is .
Above is a table that establishes one data point to depict all of the data collected in the trials, now the variable can be graphed.
I chose to process and present my data in a quadratic relationship because it encompasses how optimal pH level and how it produces the most foam and O2 liberated from the reaction. The higher you go and the lower you go from this neutral, optimal pH leads to less foam and less of a reaction, the eventually lead to denaturizion of the enzyme.
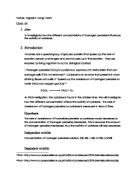
Conclusion- When examining the data collected with reference to my hypothesis, a quadratic relationship between the pH level of the H2O2 solution and the height of the bubbles is appropriate. Gathering from the graph, there was a optimal level of 6 pH for the maximum catalytic activity, where there was a high of mm of foam produced. This is because the changes in pH level of the H2O2 solution have the ability to make and break intra- and intermolecular bonds within the enzyme, therefore causing a change in shape of the active site that directly affects the effectiveness, depicted through the height of the bubbles. The shape of the active site becomes distorted when the pH level is too high or too low from the optimal pH level, such as at 2 pH where there is only mm of foam produced. Therefore the H2O2 or the substrate cannot fit properly into the active site of the catalase. The higher the bubbles, the more the enzyme catalase decomposes the H2O2 solution into the products oxygen (O2) and water (H2O), depicted in the chemical equation below.
2 H2O2 ------------------>2 H2O+ O2
Limitations of Experimental Design - Overall, the method chosen for this investigation sufficiently fit the research question, however there are some factors that are not taken in account that could have affected the outcome. For instance, the method for measuring the catalase activity using the height of the bubbles was fairly accurate and produced a practical and legitimate trend, however a more precise method could have been approached. Also I did the best I could to control the temperature of all of the materials and keep them constant, but when I could not record the temperature there could have been slight variations that could alter the result, considering catalase is sensitive to temperature change. As a limitation using a wide range of pH solutions would give a broader prospective of how varied pH levels of a substrate truly affect catalase activity, however the recourses were not present at the time. If I had access to more than 5 different pH levels, the extra data points would establish a stronger support for the quadratic relationship. Anomalies that I had encountered included separation of the solid and liquid of my Red Potato catalase Source, and knowing that if I tried to react and un-mixed catalase source, my results would probably be less effective and have less foam. To minimize these adverse effects, I paid critical attention to my catalase before each trial and was constantly stirring it back to its original condition. All in all, the experimental design did answer my research question and had minimal adverse results due to poor lab techniques. The reliability of my data corresponds with my background information, and provides stable evidence with quantitive and qualitative data to support.
Suggestions for Improvement
- A larger range of pH solutions to alter the H202 solution would establish a stronger relationship.
- Using an O2 detector could provide a more accurate detection of the oxygen liberated from the reaction.
Resource of Picture:
http://www.rsc.org/Education/Teachers/Resources/cfb/enzymes.htm