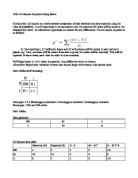
Null Hypothesis: A 1:2:1 ration is expected. Any difference is due to chance.
Alternative Hypothesis: Variation in bean size caused larger white beans to be picked more.
Data Collection/Processing:
Genotype: 1:2:1 Homozygous dominant: heterozygous dominant: homozygous recessive.
Phenotype: 75% red 25% white
Data Tables:
Data gathered:
Chi Square data table:
Total: 1.8+1.8 = 3.6
P value= 5.99
Accept null hypothesis
Class data:
Averages:
2+6+4+6+4+4+3+4+7= 40
40/9 = 4.4 RR
10+11+10+10+12+9+10+13+5=90
90/9=10 Rr
8+3+6+4+4+7+7+3+8= 50
50/9= 5.6 rr
Averages Chi square
Total= 0.0104
0.0104 smaller than 5.99 so accept null hypothesis
Conclusion:
This experiment ended in the null hypothesis being accepted. In our group, two homozygous dominant alleles beans were picked, 10 heterozygous dominant were picked, and 8 homozygous recessive were picked. This made the chi square value 3.6, while the table value is 5.99, making it possible to accept the null hypothesis. The class groups averaged about 4.4 homozygous dominant, 10 heterozygous dominant and 5.6 homozygous recessive, making the chi square value 0.0104, which is much less than the table value, 5.99, also making it possible to accept the null hypothesis.
Some sources of error can be found. The beans were different sizes, possibly changing the color of bean that was picked, making more white ones appear. Other groups in the class used red and brown beans, which are hard to tell the difference between, and they may have accidentally recorded the wrong colors, altering the values. Also, some people may have peeked into the cup, allowing them to choose which ever bean they wished.
Some steps to make this experiment more accurate may be taken. The beans could have been more even in size, lowering the error that occurred. Different color beans should have been used, which would lower the accidental incorrect recordings. Also, the students should be closely monitored so they will not peek.