Procedure
- The chicken liver was cut into pieces each measuring approximately 1cm by 1cm by 1cm. Gloves were worn when handling liver tissue.
- Using a syringe, some coloured liquid was introduced into the U-shaped tube such that there was some liquid in both arms of the tube. The column of liquid in the U-shaped tube was continuous and there were no bubbles trapped within.
-
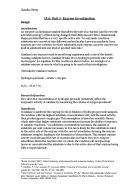
The apparatus was set up according to the following figure.
- Wearing gloves and safety goggles; a pair of forceps was used to add a piece of chicken liver into the boiling tube.
-
Using a measuring cylinder, 5cm3 of hydrogen peroxide solution (beginning with 5% concentration, ending with 0.5% concentration) was added into the tube.
- The bung was immediately placed back into the tube.
- The stopwatch was started immediately and how long it took for the fluid in the U-shaped tube to rise by 5cm was timed.
- The tube was occasionally agitated to help mix the contents.
- The tube was washed after use.
- The liquid in the U-shaped tube was replenished when needed.
- Steps 4 to 10 for 4%, 3%, 2%, 1%, and 0.5% hydrogen peroxide solution were repeated.
Results
Pooled data of the time taken for the coloured liquid to rise by 5cm against concentrations of 5%, 4%, 3%, 2%, 1%, and 0.5% hydrogen peroxide:
The average time taken for the coloured liquid to rise by 5cm against concentrations of 5%, 4%, 3%, 2%, 1%, and 0.5% hydrogen peroxide, and the standard deviation:
Calculation’s Involved
Average time taken for the coloured liquid to rise by 5cm (seconds)
=
Repeated for each concentration of Hydrogen Peroxide Solution
E.g. Average time taken for the coloured liquid to rise by 5cm (seconds) when Concentration of Hydrogen Peroxide Solution is at 0.5%
Standard Deviation =
E.g. Standard Deviation for 0.5% Concentration of Hydrogen Peroxide Solution
D.P.
Conclusions
As seen by the varying times taken for the coloured liquid to rise by 5cm (seconds) ±0.01seconds at different concentration of hydrogen peroxide, all pieces of chicken liver have differing reactions to the hydrogen peroxide due to the different amounts of catalase present in the tissue.
As seen by the differences in time taken for the coloured liquid to rise by 5cm (seconds) ±0.01seconds, at different concentrations of hydrogen peroxide, the rates of catalase activity in the chicken liver differ.
The general pattern in the average time taken for the coloured liquid to rise by 5cm (seconds) ±0.01seconds at hydrogen peroxide concentration of 0.5%, 1%, 2%, 3%, 4%, and 5% suggest an inverse relationship between the time taken and the concentration of hydrogen peroxide as the graph begins at 28.60 seconds (at 0.5% hydrogen peroxide concentration), and ends at 1.07 seconds (at 5% hydrogen peroxide concentration). This means that the rate of catalase activity is directly proportional to hydrogen peroxide concentration.
Due to the high standard deviations of the first three data points (0.5% - 4.63 D.P., 1.0% - 6.11 D.P., and 2.0% - 2.38 D.P.), the averages of the time taken for the coloured liquid to rise by 5cm (seconds) ±0.01seconds at hydrogen peroxide concentrations of 0.5%, 1.0%, and 2.0% are highly unreliable.
Despite the high standard deviations of the first three points, the last three points (3.0% - 0.55 D.P., 4.0% - 0.73 D.P., 5.0% - 0.28 D.P.) have relatively low standard deviation points, remaining reliable, and holding the analysis true.
Thus, it is safe to conclude that the rate of catalase activity is directly proportional to hydrogen peroxide concentration – the higher the concentration of the solution, the faster the activity of catalase because the decomposition rate of hydrogen peroxide increases when its concentration is higher (in the presence of chicken liver).
Evaluation
The individual chicken liver pieces were not very accurately cut and measured due to their slippery nature. A further way of ensuring equal size of liver pieces could be to weigh them – making sure that the pieces are equal both in size and weight, allowing more accurate reactions and accurate data.
When the rubber bung was inserted back into the tube after the hydrogen peroxide had been added, due to the added pressure, the coloured liquid may have been forced up by pressure of insertion, and not just by the reaction between the hydrogen peroxide and chicken liver. In order to avoid severe distortion of results, the rubber bung should be inserted slowly and insertion time should be measured and be equal for each investigation. Also, by collecting data when the coloured liquid had risen to 8cm and 10cm, the results and conclusions would be more extensive and reliable with more data to back them.