Data Table:
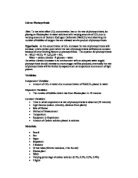
Graph to Show the Relationship Between Light Intensity (lux) and the Number of Bubbles Produced in a 30-Second Period in a 400mL Sodium Hydrogen Carbonate (5g) Solution
Conclusion:
The results I obtained obviously support my hypothesis that at low light intensities, the rate of photosynthesis is slower than the rate of photosynthesis at higher light intensities, and is very well demonstrated by the above graph. The chlorophyll absorb more light when under higher light intensities, thus allowing increased reaction rates. Oxygen gas was produced, which I counted as bubbles were produced and floated to the top of the solution. More oxygen gas had to be produced to make more bubbles, logically, so it is evident that the increased light intensities resulted in increased photosynthetic reaction rates in the elodea. I also predicted that, at a certain point, the effect of increased light intensity would have no more effect because there would be some other limiting factor and the graph would begin to plateau. A t-test I performed showed that the mean number of bubbles produced at the highest light intensity I used was significantly different from the mean number of bubbles produced at the lowest light intensity I used. I can tell that they are significantly different because the result (the comparison of the means of the two light intensities) of the t-test showed was higher than 2.78. So, it is with 95% confidence that I can say that the lowest-light-intensity-tested results were significantly different than the highest-light-intensity-tested results.
As shown in the graph above, the rate of reaction increases steadily, until the light intensity reaches somewhere above 300 lux, at which point there is a much steeper slope in the graph. Also, as shown by the tests at 420 lux and 640 lux, the graph begins to plateau very quickly after the previous steep incline. This means that at a point around 300 lux, the photosynthetic reactions are very responsive to increased light intensities but at some point before 400 lux, increased light intensity bears less response. This means that the maximum photosynthetic rates were reached, or more likely, that some other factor limited the rate of reaction.
Evaluation:
Though I believe I had a successful experiment and obtained accurate results that supported my hypothesis and my knowledge of photosynthesis, there were numerous limitations and improvements that could be made to this experiment. Also, I had to change my method since my first attempt at using leaf discs to show the effect that light intensity had on the rate of reaction did not work. After three classes of attempting to get results in that way, I decided to use the elodea method in which I counted bubbles at different light intensities. In the leaf discs and syringe experiment, I attempted to change my method of making the leaf discs sink by decreasing the volume of sodium hydrogen carbonate powder I added into the solution, but even with just 0.5g of sodium hydrogen carbonate solution in 200mL of distilled water, I could not get the discs to sink.
Size of oxygen bubbles produced by elodea
In my experimenting, there was never a time that I noticed that the bubbles started building up at the tip of the elodea stem to create significantly larger bubbles; at a miniscule level though, I’m sure that there must have been some variation in the size of the oxygen bubbles. I noticed that other students recorded this problem in their experiment, also. I attempted to control this by positioning the elodea stem so that it pointed straight up to the surface of the solution and had no obstacle in the way, like the funnel.
Inaccurately measured distance from light source
The distances between the light and the elodea were not measured with any accuracy besides estimation between where the lux meter was at the point of measuring and where the beaker was actually placed. The impact this may have had on my experiment is an inaccurate result. For example, since the light intensity fluctuates severely with changing distance, the light intensity at the spot I placed the beaker after measuring may have been an extremely different light intensity than what it truly is, possibly up to a difference of 50 lux. To lessen the impact of this, I could measure the distance with a ruler in a future experiment and mark the spot to place the beaker after measuring.
Light sources being shared with other people
I shared my light with one other person doing the same experiment as I. The effect of this could possibly have been that the elodea I was using did not get all the light that it could have gotten had there been an adequate supply of light sources, hence distorting my results. Maybe the predicted light intensity from the lux meter was lessened as I had to move my beaker a little bit to the side, but at the same distance from the light source, for the other person to test their hypothesis. The best way to extinguish this limitation is to have a sufficient amount of light sources available for the students, although this of course may not be possible in our situation.
Changing/refreshing of sodium hydrogen carbonate solution
It would make sense that during each experiment, the elodea uses carbon dioxide and oxygen from the solution, and so the effect of this is that in later tests there would obviously be a smaller concentration of those for the plant to photosynthesize and respire with. I’m unable to determine whether or not changing the water would have made a significant difference in my data, but to standardize the experiment, I could change the water at each light intensity tested, using the same specifications of course.
Changing of elodea between trials
Of course, though it would be tedious to get fresh elodea with similar masses after each light intensity test, this would make the results of my experiment more reliable because in my experiment since I used the same piece of elodea throughout the experiment, the rate of photosynthesis may have increased in a manner not having to do entirely with increased light intensity, hence there may have been some factor involving the continuous use of “old” elodea limiting the accuracy of my results.
Increase in water temperature over course of experiment
Changing the water at each light intensity that I test could also eliminate this limitation. Over time, as higher light intensities are tested, the water temperature could have increased due to the heat given off by the 40W bulb. This could make the data I collected invalid or unreliable because it could have been the temperature that increased the photosynthetic reaction rates, though most likely not.
Light from other sources
The light given off by the lights in the ceiling or from the sun coming through the window or light from other experiments may have affected the photosynthetic reaction rates of the elodea while I was setting up the experiment, though it would not have been by a very significant amount. If this happened, the results I obtained would be a little bit distorted. A solution to this limitation would be to do all the experimenting behind a poster board that blocks out as much ambient/background light as possible and to have students do experimenting in different rooms or areas.
Oxygen used in plant respiration or dissolved into water
Some of the oxygen produced may be used for other processes, including respiration or dissolving into the water. This would have only a very small effect on my experimenting and is impossible to control in an experiment where the plant is submerged in water.
Replication
In my experimenting, the time constraints and continuous modification of my experiments allowed me only to obtain three trials per light intensity and to do 5 different light intensity tests. The impact this has is that because of the relatively low amount of replication, the results are not extremely convincing, though there is evidence of support of my hypothesis. To help get rid of any anomalies and extend the range of data tested, this experiment could have been done with a wider range of light intensities and more trials per light intensity could have been performed.