Data Collection and Processing:
For the experiment, data was taken from six different samples. We cut six of the same size potato cores and measured the mass. After we measured the temperature of each cup filled with water and the solutions. Five of the cups had a different amount of sucrose solution and the sixth cup was just filled with water and its constant. Placing the potato wedges in the different solutions, the osmosis began to work and I left the cups sealed for a day. The next day, the temperature was measured again and it would stay identical to day one. Then, the potato wedges would be drained out of the solution and would be damped and measured of its mass. The following chart is the raw data that was taken from the experiment.
In the chart you can see the masses measured of the first days with its uncertainties of ±0.01g and its temperature of ±0.05°C. The degrees would stay the same in both days but as you can see there is a change is the data for mass from day one to day two. The osmotic pressured was also measured causing the loss of mass in the potato.
The chart above is the data of the osmotic pressure of the solution and the potato core. The osmotic pressure is found using the formula OP=-MiRT. M is the molarity of each cup, which would be the amount of sucrose solution in the cup. For example, Potato 0.4 the molarity would be -0.4. The symbol (i) is the ionization constant that will remain 1 and r is the gas constant, which is 0.0831. This is all multiplied together with the temperature measured in each solution.
OP of Potato 0.4
OP=-0.4(1)(0.0831)(23.5)
=-0.78114
Data Analysis:
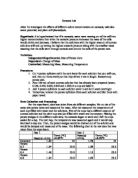
The data being shown is the graph of the masses taken in day one and day two of the experiment. The masses were measured and now are analyzed to see if you are able to detect a difference and understand if osmosis was taken place in the sucrose solutions. The following graph shows the in the constant solution, water only made the potato more dense and thus letting water increase the cells and making the mass increase from 1.34g to 1.78g. This trend occurred only once more with the sample of Potato 0.2 that contained the least amount of sucrose. Although the increase was not as noticeable like the constant, the mass did have an increase. The rest of the samples did have an increase in mass showing the water traveled in higher concentrations of the cells in the potato through osmosis thus shrinking the mass and causing it to weigh less.
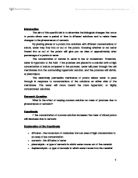
The next graph shows the osmotic pressure of each sampled cup. As told before, the Osmotic pressure helps the inward flow of water in the semi permeable membrane during osmosis. The higher the pressure, the less water is entering into the cell causing it to shrink. The following graph gives a direct understanding of how the pressure increases negatively as more of the sucrose solution is added into the cup.
Conclusion and Evaluation:
In conclusion, my hypothesis was correct showing the higher sucrose solution the decrease of mass would occur through osmosis. In the experiment I was able to decipher that the more sucrose involved the more solute the solution gets. When the solution becomes solute it becomes a hypertonic solution that allow the potato cores to get smaller and lets water move out of the cell at higher concentrations. The mass was decreasing in the potatoes because the potatoes were losing water causing the cells to shrivel up.
This experiment was very accurate because we used electronic devices to measure all the data points taken. The uncertainties were all put into account so room for error was not a big factor in this experiment. A limitation that can be made is that the experiment was only a two-day period and time wasn’t very flexible causing to rush the experiment. Also, it would have been a more decisive experiment if we were able to take more trials of each solution for the best possible accuracy. If I were to make any improvements on the experiment, it would be an increase in days to perform the experiment and also more trials to analyze for accuracy.