Time
The time span in which the cellulose bags were kept in the beakers were always at a constant time of around 24 hours. This number may not be a 100% accurate for all of our tests, but we made sure that the 24 –hour rule was kept throughout all of our tests. The slightest change in time may not have made a significant change to the rate of osmosis in this case, as osmosis is not something that happens instantly.
Volume
The volume and amount of distilled water used in our experiment was always held at a constant amount. 10ml of distilled water was placed inside all of our cellulose bags. Each beaker was filled with 500ml of distilled water. Some of our “initial mass” measurements don’t show the figure 10 grams, as there may have been some very little water loss or gain during the process of making the cellulose bags.
Cell Size
All our “cells” were cut and made at the same size. This was done to make sure that no cell would have greater surface area that may affect the rate of osmosis, and therefore make our experiment not fair.
Scale
The same electronic scale was used at all times in measuring the numerous things in our experiment. This accurate scale was used to prevent and mass differences that could make our experiment inaccurate.
Apparatus
- Cellulose Tubing
- Distilled Water
- Beakers
- Graduated Cylinder
- Electronic Scale
- Scissor
- String
- Ruler
- Salt
- Stirring Rod
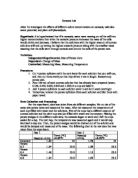
Procedure
- Gather and prepare all the items from the list of apparatus’.
- Fill 5 beakers with 500ml of distilled water each.
- For the first set of results (5 beakers), no salt is needed to be placed into the beaker. For the second set of results, place 25 grams of salt that you have measured on the electric scale into the beaker. Place the same amounts of salt into each beaker. Increase the amount of salt by 25 grams for each set of results. The fifth and final set of results will contain 100 grams of salt in the beaker.
- Stir the salt with a stirring rod until the salt completely dissolves.
- Cut out 14cm of cellulose tubing with scissors. Cut out 5 of these, one for each beaker.
- Tie one end of the cellulose tubing, and by using the graduated cylinder, place 10ml of distilled water into the slightly wet cellulose tubing.
- Tie the other end, and then to prevent water loss, tie a double knot at each end with pieces of string.
- At this point, weigh the initial mass of the cell and record it using an electric scale.
- Place the cellulose tubing into each beaker.
- Place the 5 beakers in a cupboard, and wait 24 hours for osmosis to take place.
- Take out the cellulose bags, dry them off a little, and then weigh their “final mass” to find out how much water was gained/lost due to osmosis.
- Record the difference, which indicated the rate of osmosis.
Setup
Raw Data
Table 1 - Mass Measurements for a Dialysis Bag containing various concentrations (+0.85-0.86 M) of salt after being placed in 500ml of distilled water for 24 hours
⇒Table 1 shows our collection of data, in which we recorded our initial and final mass of the cellulose bags for each trial and each concentration of our experiment (5x5).
Table 2 – Differences in Mass Measurements for Dialysis Bag containing various concentrations (+0.85-0.86 M) of salt after being placed in 500ml of distilled water for 24 hours
⇒Table 2 shows the difference in mass between the final mass and the initial mass of the cellulose bags. The averages of the 5 trials for each concentration are stated at the bottom.
Table 3 – Standard Deviations of Error Bars for Dialysis Bag containing various concentrations (+0.85-0.86 M) of salt after being placed in 500ml of distilled water for 24 hours
⇒Table 3 shows us the standard deviation of our results. This is used to show some of the uncertainties/errors in our results that may occur.
*Errors and Uncertainties
The electronic scales that we used to measure the initial and final mass of the cellulose bags is accurate to ±0.01 grams. Also due to some slight leakage, there are minor differences in initial mass’ weighed. This is due to the fact that our cellulose bags are tied by strings, which will not keep it 100% watertight.
Our molarities of our bags are at the most ±0.01 M off. With our increments of 25 grams of sugar in 500ml beakers, our molarities differed by about 0.85 M each (±0.01 M).
These little uncertainties may not make some of these figures a 100% accurate, but these numbers with slight errors are accounted for through the calculations of standard deviation in Table 3.
Graph
This Scatter Graph shows the average difference in mass of the cellulose bags (Table 2 data) in relation to the salt concentration (Molarity). The error bars present are represented from the standard deviation figures calculated in Table 3. The line, or slope, represents a line of best fit that matches to the various points on the graph.
By looking at the graph, it is evident that as molarity increases, there is a greater loss in mass of the cellulose bags. This suggests that an increase in salt concentration increases the rate of osmosis.
Conclusion
From the data we collected in Table 1, it is evident that the higher the concentration of salt, the greater the rate of osmosis is. This general trend is very clear from the data we collected, with the smaller salt concentration having smaller changes in mass. Water leaving the high concentration of water inside the cell moved out to an area of less concentration. This “lesser” concentration of water is caused by the amount and concentration of salt. An increase in salt increases the concentration of salt, which means that there is a lesser concentration of water. This explains the increase in the rate of osmosis out of the cell in a hypertonic solution. Our first experiment with 0 grams of salt is an example of a isotonic solution, where water diffuses in and out of the cell at the same rate, meaning that there is no real change in mass.
Table 2 further supports the idea stated above, as the averages of mass difference show a steady increase in the amount of water the cellulose bag is losing as salt concentration increases.
The standard deviations calculated in Table 3 remind us that there is always a level of uncertainty in our results. Our goal is to reduce the “errors”, and to get an even more accurate reading of results. At one point in the graph, one of the error bars does not go through the line of best fit. This is an indication of the “errors” still present from the collection of data, meaning that there is room for improvement to make these uncertainties more accurate. Increasing the number of trials or disregarding “bad” results would probably have made certain that all error bars passed through the line of best fit. Despite this, the main concept of the experiment is shown clearly on the Graph. Going back to my original hypothesis, I was right about the idea that an increase in salt concentration would mean and increase in the loss of water from the “cell”.
Weaknesses/Limitations
One of the weaknesses of our experiment was the measuring of our materials. Precision can be very key to good test results, and I feel that our slight carelessness in measuring things led to some “errors” in our experiment. Even though we used electric scales, I feel that when we measured the initial/final mass of the cellulose bags, there was excess water that was unaccounted for. This also goes for measuring the salt, as many times we couldn’t seem to get exactly 25.00 grams.
Another weakness was probably our method in making the cellulose bags to make it 100% watertight. Water was definitely lost while we tied the tubing, and I feel that the string is not a good enough material to keep the water in the cellulose bag for a period of 24 hours.
One smaller factor of “weakness” could have been the time of putting the cells in the beaker. Since we are school students, it is near impossible to take out our bags in exactly 24 hours, but if we could, it would help us get better results. An extra 10 or 15 minutes may not seem like a lot of time, but it may have a bigger meaning in the rate of osmosis.
Improvements
The biggest improvement would be to use some other material other than cellulose tubing to do our experiment. I feel that all the cutting and tying makes the cellulose tubing a lot weaker, as we are constantly touching it and probably making the material weaker and slightly more “permeable”. This I feel changes osmosis rates drastically. Using other semi permeable materials other than the cellulose tubing will probably improve the accuracy in our results. I saw some other people mention and experiment with cucumbers, and I feel that something like that will be a better item for use in this experiment.
Personally I felt that 24 hours was not enough time to really see and analyze the rate of osmosis. Ideally, I would like to extend the time of observation from 24 hours to something around 72 hours for each experiment. I think increasing the observation time will allow osmosis to “fully” happen and will help us attain better and more accurate results.