Human stomach:
Stomach is part of the human digestive system. It has a saclike shape and is located between the esophagus and the intestines. The stomach is about 30.5 cm long and 15.2 cm wide. The capacity is about 0.94 liters in an adult. Food enters stomach and the gastric juices break down the food. Some substances are absorbed before entering the intestines.
Gastric acid is hydrochloric acid secreted by the stomach. The highly acidic environment in stomach (pH of 2) enables stomach to kill bacteria before food entering intestines. However, it causes proteins from food to lose their characteristic folded structure. They denature. The stomach also secrets pepsin, an enzyme breaks down peptide bonds between amino acids, a process known as proteolysis. Thus the protein digestion mainly happens in human stomach.
The temperature of human stomach corresponds to human body’s temperature: around 37 Celsius degrees.
Enzyme-substrate reaction and substrate specificity of enzymes:
The reactant an enzyme acts on is referred to as the enzyme’s substrate. The enzyme binds to its substrate, forming an enzyme-substrate complex. While enzyme and substrate are joined, the catalytic action of the enzyme converts the substrate to the product of the reaction.
The reaction catalyzed by each enzyme is very specific; an enzyme can recognize its specific substrate even among closely related compounds. Only a restricted region of the enzyme molecule actually binds to the substrate. This region is called active site.
Pepsin has broad specificity with a preference for peptides containing linkages with aromatic or dicarboxylic L-amino acids. It preferencially cleaves C-terminal to Phe and Leu and to a lesser extent Glu linkages. The enzyme does not cleave at Val, Ala, or Gly.
We chose pepsin as the enzyme because this is the enzyme in human stomach and we believe it will work on most foods we test (substances).
Hydrophobic vs. hydrophilic
A hydrophobic molecule is repelled by water. They often cluster together when dropped in water, just as oil does. Hydrophobic molecules are also called lipophilic because they will dissolve in oils and other lipids. They tend to be electrically neutral and nonpolar and work better with neutral and nonpolar solvents.
Hydrophobic molecules include alkanes, oils, fats and other greasy substances.
Hydrophilic is typically used to describe a property of a molecule and refers to the likelihood of its bonding with the hydrogen molecule in water. A hydrophilic molecule is not just soluble in water but also in other polar solvents. It will dissolve less readily in oils and other hydrophobic solvents.
Variables
Independent variable: protein to fat concentration ratio in solid proteins tested
Water concentration in solid proteins tested
Dependent variable: Protein digestion rate
Controlled variables:Temperature of the environment (corresponding to human stomach: 37.0 oC +/-0.01 oC)
pH value of the environment (amount of HCl: 0.10M)
Amount of pepsin (162 mg in every 200 ml 0.1M HCl solution)
Amount of solid protein being tested (10.0 g +/-0.01g)
Control of variables
- Temperature: to keep the temperature in beakers as constant as possible (37.0 oC), I used hot water bath method. I put 5 beakers into a big cooking pot filled with 4 liters of water. By heating the water in cooking pot to 37.0oC first, the solution in the beakers will keep the temperature rather constant because it takes longer time for larger amount of liquid to cool down. The temperature in the beaker is measured every 15 minutes from the beginning till the end of the experiment to keep constant.
- pH value of the beaker: to mimic the human stomach, the HCl concentration in the beaker corresponds to the HCl concentration in human stomach: 0.10 moles/liter. So I added 20.0 ml of 1.00 M HCl to every 180 ml of water to make 0.10 M HCl solution.
- Pepsin: in every beaker we put 162 mg of pepsin (1 pepsin capsule) and stirred it till all the powder completely dissolved in the HCl solution.
- Solid protein: 10.0 grams of each type of solid protein is measured and to be tested.
Materials used
5 x 500 ml beaker
1 x 100 ml graduated cylinder
5 x Pepsin capsules (Solaray Dietary Supplement from Vitamin Shoppe)
1 x Scale (uncertainty: +/- 0.005g)
1 x Thermometer
2 x Bottle of 1M HCl solution (20.0 ml of 6.00M HCl with 100 ml tap water)
3 x Safety goggles
3 x Pairs of safety gloves
1 x Cooking pot (as big as possible)
1 x Chopstick
Procedure:
1) Measure 10.0 g of each of 5 solid proteins (tofu, chicken, egg white, cheese and nuts)
2) Put 180 ml of tap water into each of 500 ml beakers.
3) Put 20.0 ml of 1.00M HCl into each beaker (5 in total).
4) Labe the beakers with number 1 to 5.
5) Put 1 pepsin capsule into each beaker (only the powder inside the capsule)
6) Put the chicken breast into beaker #1, tofu into beaker #2, cheese into beaker #3, nuts into beaker #4 and egg white into beaker #5.
7) Put 4 liters into the cooking pot and start heating it until it reaches 37.0 oC.
8) Put all 5 beakers into the cooking pot and using thermometer check the temperature of the beakers every 15 minutes till the end of the experiment (7 times).
9) Measure the weight of the solid proteins in each beaker every 30 minutes for 4 times in total. Use chopsticks to transfer the food.
Data collection: see handout attached
Data processing:
The chart below shows the measurement of the temperature in Celsius degrees of the beaker #1 as sample every 15 minutes.
The chart below shows the weight of the solid protein in each beaker measured every 30 minutes.
Data presentation:
Steps to calculate the protein digestion rate in one time period:
100% - (Mass (g) of protein after 30 minutes / Original mass (g) of protein in food sample)
The chart below shows the protein digestion rate of solid proteins in each beaker over a period of time
The negative number indicates the increase in weight of the solid protein due to the water absorption. This is caused by diffusion of water from higher concentration (HCl solution) to lower concentration (food).
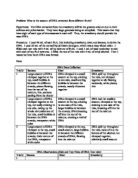
The line graph below shows the protein digestion rate of different proteins over period of time
From the graph we can observe that in the first half hour, cheese will have the highest protein digestion rate and nuts will have the lowest protein digestion rate. In the second half hour, the protein digestion rate of egg white and cheese will be stopped. Chicken breast will have the highest protein digestion rate and nuts will still have the lowest protein digestion rate.
Conclusion
The data supports part of my hypothesis. Different types of solid proteins have different digestion rates. The mixed nuts had the slowest digestion rate because nuts had the lowest protein to fat concentration ratio (0.336 : 1) and lowest water concentration (1.75%).
My hypothesis about egg white having the highest protein digestion rate because egg white has the highest protein to fat concentration (egg white is fat free) and highest water concentration (87.%) is not supported by the data. This is caused by the 54.0% of ovalbumin and 11.0% of ovomucoid in the egg white. Ovalbumin and ovomucoid are nourishments in egg white which are protease (digestive enzyme) blocking proteins. Although pepsin has broad specificity, in this case its activity is blocked by ovomucoid and ovalbumin.
Overall, boiled chicken breast has the rather constant and high protein digestion rate throughout the experiment. This supports the theories behind my hypothesis. Other than boiled egg white, chicken breast has the highest protein to fat concentration ratio (43.1: 1) and the highest water concentration (76.7%).
The solid proteins being tested can be put into two categories: egg white and cheese are the fast digesting proteins and nuts, chicken breast and tofu are the slow digesting proteins which the process last longer in human stomach.
Evaluation of experiment
Although the data supported our hypothesis, human errors, random errors and two important systematic errors occurred during the experiment.
First, only small amount of pepsin was mixed with the HCl solution thus it is important not to lose any of the chemical. We used the diameter of 0.5 cm chopstick to stir the solution to help the pepsin to dissolve faster but some of the pepsin powder was stick on the chopstick when we pulled it out. The surface area of chopstick which touched the water was around 7.85 cm2 +/-0.005cm (r = 0.50 cm and h = 10.0 cm, h) and some pepsin powder was stick on this surface area. This also caused unequal amount of pepsin in different beakers and since the amount of pepsin in each beaker is a constant variable, this error affected the result.
From 4:27 p.m. to 4:57 p.m., the temperature of the beaker wasn’t kept exactly around 37.0 oC. The temperature dropped to 36.2oC which also affected the result in that period since the enzyme couldn’t work efficiently in 36.2 oC environment. This can be considered as both human and random error. The researcher was unable to keep the temperature constant due to lack of proper equipment but the time when the experiment was carried out (12/5/2009, 4:00p.m. – 6:00p.m.) the weather was cold and rainy and it caused the water in the cooking pot to cool down faster than the researcher expected.
The number in the second chart on raw data does not match the number on the chart in the processed data section because the researcher made a human error by ignoring the significant figures.
During the experiment, the researcher failed to measure the temperature of every beaker in the cooking pot. Instead, we took one beaker as a sample (beaker #1) and assumed that the temperature of other beakers would be the same. It was a wrong assumption because we failed to check whether the cooking pot was placed in the center above the stove and whether the fire came from the stove equally. It might cause that part of the water in the cooking pot has higher or lower temperature than other part. Although the temperature of the liquid in the cooking pot will be the same after a while, the smallest difference in temperature could affect the enzyme activity which could cause a systematic error in the result.
At the beginning of the experiment planning, instead of measuring the solid proteins of the same weight, I wanted to use samples of the same size (1 cm x 1 cm x 1 cm) but soon I realized that same size samples would have different weight (eg. same size cheese is heavier than egg white). But it is a controversial issue because the amount of surface area touching the enzyme is an important factor which decides the protein digestion rate. 10.0 g of cheese is much smaller than 10.0g of egg white thus have much smaller surface area and enzyme will work better with egg white than with cheese because egg white and pepsin will have more contact area. I failed to take this factor into consideration and it caused another systematic error in the result.
Although the data supported our hypothesis, we cannot say that the data is valid due to the errors we made during the experiment.
Improving the investigation
Many errors in our investigation were due to lack of equipment. The realistic suggestion of correction the error is to use hot plate to stir the solution instead of using chopstick. The hot plate does not touch the solution direction thus would not carry any chemical with it. The hot plate can also warm up the solution which can be more accurate than using stove. The temperature can also be more easily controlled by using the hot plate because it is easy to overheat the solution using the stove.
Regarding the surface vs. weight issue, it would be better to use the samples of the same surface area and record the weight of each one. Although the samples would have different weights, researcher can use formula to calculate the protein digestion rate for each sample without leaving any factor into consideration.
Resources
Background information:
Biology, 7th Edition by Campbell Reece. Publisher: Benjamin Cummings, 2005
Picture: