1.2.2 Control experiment- Subjects will be asked to breathe under normal conditions with the dependant variables recorded. Subsequent data will be compared against this control.
1.3.0- Experimental method
1.3.1- Materials and apparatus
Martials
500mls of non toxic decontamination fluid
500mls of distilled water
Apparatus
8 pieces of 0.8cm PVC tubing sizes 25cm, 50c, 75cm and 100cm respectively (2 of each)
1 stop watch
1 heart rate monitor
1 spirit cloth
1.3.2- Safety aspects (table 2)
1.3.3- Method
Heart rate
1-Subject is asked to sit down and breathe normally
2- Time subject for 30 seconds
3- After 30 second heart rate is taken for 1 minute
4-Recond number of heart beats after 1 minute
5- Subject is asked to rest for 1 minute
6- Subject is required to inhale through 25cm pipe for 30 seconds
7-Heart rate is recorded for 1 minute
8- Repeat steps 5, 6 and 7 for pipe lengths 50cm, 75cm and 100cm.
Breathing rate
1-Subject is asked to sit down and breathe normally
2- Time subject for 30 seconds
3- After 30 second the number of breaths in one minute observed
4-Recond number of breaths after 1 minute
5- Subject is asked to rest for 1 minute
6- Subject is required to inhale through 25cm pipe for 30 seconds
7-Breathing rate is recorded for 1 minute
8- Repeat steps 5, 6 and 7 for pipe lengths 50cm, 75cm and 100cm.
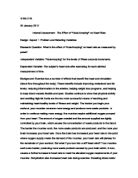
1.3.4 Experimental set up (diagram 1)
Normal breathing Pipe induced breathing
Bibliography
Larry Rigby, L.R, 2008, pg 1, Oxygen on Everest, Stories of Everest, Accessed on the 01/02/2010
VBulletin, Website, 2008, pg 1, Compressing air, Physics forums, Accessed on the 01/02/2010
Blurtit, Website, 2008, pg 2, Less bodily oxygen, The Reparation system, Accessed on the 01/02/2010,
LibraryQuest, Website, 2008, pg 1, Oxygen distribution, The respiration system, Accessed on the 01/02/2010
Kate Colwy, K,C, 2005, pg 1, Asthma and pulse rates, Conditions affect the heart, Accessed on the 01/02/2010
Scum Docter, S,D, 2008, pg 1, Optimal heart and breathing rates, Good body health, Accessed 3/03/2010,
2.0.0 Data collection and processing
2.1.0 Recording raw data
2.1.1- Qualitative data
Subject when inhaling through a pipe showed no signs of physical distress. However it can be observed that the time taking for a full inhalation was significantly longer for pipe inhibition experiments suggesting that breathing rates had slowed. When subjects were inhaling through the pipes they were instructed to exhale out the nose, some subjects had an abnormal facial expressions, suggesting that they were concentrating on the task they were given. Some subjects commented that they found it took longer to breathe through piping when compared to regular breathing. A few subjects also commented that they felt slightly lightheaded as a result of the experiment. The PVC piping itself was of differing lengths. PVC pipe does not have stable structure and are prone to the forces of gravity. In some samples the PVC piping would bend backwards or to the side. In some occasions the bending caused to non contact end of the piping to become caught on clothing or something else in the surrounding, possibly limiting the size of the intake line.
2.1.2- Raw data table 1 (table 3)- The beat per minute of the heart of 16-17 year old students when breathing through different lengths of PVC piping.
2.1.2- Raw data table 2 (table 4)- The breaths per minute of 16-17 year old male students when breathing through different lengths of PVC pipe
2.2.0 Processing raw data
2.2.1- Overview- Both beats per minutes and breaths per minute were averaged and placed into a table and scattergram graph. This allowed the compassion of individual lengths (or control) in relation to other points. It also allowed direct comparison between the two graphs (each depended variable) to observe if there was in relation in the two variables.
Due to large divergence in both dependant variables a standard deviation for each data set was calculated to examine the significance of independent variance. This standard deviation was then placed into the two graphs to examine how intense the effects of different standard devotions would be on independent points and therefore the graph as a whole (If points switch).
2.2.2- Calculations used (table 5)
2.2.3- Experimental setup (figure 2)
2.3.0 Presenting raw data
2.3.1- Processed data table 1 (table 6) – Comparison of the beats per minute of the hearts of male students age 16-17 trough different lengths of PVC piping.
2.3.1- Processed data table 2 (table 7) – Comparison of the breaths per minute of the hearts of male students age 16-17 trough different lengths of PVC piping.
2.3.1- Processed data graph 1 (figure 3)
3.0.0 Conclusion and evaluation
3.1.0- Conclusion
2.3.1- Processed data graph 2 (figure 4)
The overall trend of the graph is reflective of a negatory change in the breath per minutes of year 16-17 year old students. As the length of piping increased the number of breaths that subjects could take within one minute decreased. This is perhaps comparable to the trend in figure 3. This being that as heart rate increases the breaths per minute decrease with increasing pipe length.
However unlike figure 3 a clear exponential function cannot be observed. The changes in rate of breathing at different lengths of pipe are not uniform with the greatest changes occurring at control to 25 cm and 75cm to 100cm. The changes between 25cm through to 75 cm are relatively uniform. Since these data sets are relatively disordered it can be assumed that the considerable standard deviation of the data set came into play.
If the standard deviation was to be considered then it is possible that some data sets could shift in position which could display a differing trend (this trend however would still remain negative between the points control to 100cm). Considering this it could be assumed that the trend of the graph regardless of independent changes is negative. Assuming this a graph extrapolation beyond 100cm a continual drop in breathing rates would be observed (until the point that subjects could no longer inhale at all). Breathing rate dropped below optimal limits (16 breaths per minute) at 75 cm.
3.0.0- Conclusion and eventuation
3.1.0- Conclusion
The hypothesis “Heart and breathing rates of students aged 16-17 will reach an optimal state at 50cm pvc piping.” was suggested to be partially correct without considering experimental flaws.
From figure 3 it can be observed that as the length of pvc piping increased the heart rates of male students increased as well. This increased was observed to be exponential with each independent increasing being larger than the former. This suggests that with each subsequent addition of length imposes a uniformly increasing heart rate. This increasing trend in heart rate could be compared to the decreasing trend displayed in figure 4. As the length of pipe increased the breathing rates of subject’s decreased. However the exponential trend displayed within figure 3 was not emulated in figure 4, a more chaotic trend was displayed. However, considering only the rising heart rate and the decreasing breathing rate it could be suggested that the two are related. From the two figures it seems that as breathing rates decrease, heart rates subsequently increase as the length of PVC pipe increase.
The increase in heart rate itself could most likely be explained by the suspected theory. As subjects were imposed into pipe breathing their ability to inhale and exhale was inhibited. It would have physically become more difficult to inhale and hence the rate of breathing would have slowed lowering oxygen intake. However the composition of the human body does not change which means that a lower volume of oxygen has to be transported over the same surface area. To achieve this transport the heart itself would have needed to beat faster resulting in an increase in heart rate. Hence as the breathing is inhibited further by increasing lengths of PVC pipe the levels of oxygen inhaled is limited resulting in an increased heart rate.
The extrapolation curve associated with heart rate occurred because with each increases of length the ability to intake oxygen increased according to a gradient. When oxygen is inhaled through the pipe it is first compacted into a smaller environment, and second the subject actually has the draw the air completely trough this environment. Breathing trough a pipe that is 25cm would be easier then breathing through a pipe that is 50cm because the pressure required to draw air from 25cm would be far lower. Assuming that subjects were inhaling at constant pressure the increases in the pressure required from 25cm to 50cm would be lower than the pressure required from 50cm to 75cm because of the increasing pressure gradient. This increase via pressure gradient is much like the affects of pressure on volume which is experienced by scuba divers. At 10m a scuba diver absorbs twice as much air, at 20m four times as much and at 30m eight times as much and so on. With each 10 m increase in depth that pressure and hence volume intake increases by a factor of two. Similarly in the experiment subjects were talking in less oxygen at increased lengths of piping as the pressure gradient did not change but the distance air was drawn from did. If the graph were to be extrapolated or more independent variable points added a more accurate representation of the extrapolation curve could be seen.
However if this statement about extrapolation was unquestionably true then the similar extrapolation curb should have been observed in figure as breathing would become more difficult based upon the pressure gradient. This however was not observed with figure 4 showing a relatively random decreasing pattern. However despite the differences in the shape of the curb it is still quite likely that both sets of data abide to a law of extrapolation. The increasing trend in figure 3 was uniform to the decreasing trend in figure 4 with each independent length displaying the same trend on each graph. For example when 25cm figure 3 raised the adjacent 25cm figure 4 falls, and when the 50cm figure 3 rose the adjacent 50cm figure 4 fell and so on. This strongly suggests that a relationship between figure one and figure two is a reflection which each figure 3 rise being represented as a similar figure 4 fall and vice versa. This suggests that figure four may in fact have a exponential trend but this is not shown due to large data variance (standard deviation). Another possibility for the change in breathing trend could be that in samples 50cm and 75cm (displayed the smallest change) the subject were adjusting to changed breathing conditions, hence they were able to more effectively control their breathing (in order to maximise oxygen intake). This would result in a decrease in breathing rates, however it would not account for the exponential trend in figure 3.
If the lengths of the pipe were further increased the subject would most likely experience and increase in heart rate and breathing rates that coincide to an exponential gradient. This could continue until either the subject could not generate sufficient pressure the draw air from the end of the pipe or when heart rate increases to such an extreme point that the subject either enters subconsciousness or cardiac arrest. This trend of rising heart rate is mostly true, however for some specific figure 3 samples such as sample 2 who dropped from 78bpm to 75bbm when inhaling through the pipe. This occurrence however is rare and should be treated as an anomaly. Similarly some samples in figure 4 such sample 5 who displayed no change in breathing rates between 50cm-75cm should also be considered are anomalies. Alternatively the before mentioned suggestion that subjects compensated for more difficult airflow is also a possibility.
Additionally conditions may differ from person to person (perhaps the subject had to work physically to reach the experiment site), which would have resulted in a discrepancy in the data as physical exercise is known to increase heart and breathing rates. The suggestion would coincide with the qualitative data. Subjects informed the experimenter that at longer lengths of piping they physically found in more difficult to breath, with some even informing that they experienced slight light-headedness suggesting that that the reduced oxygen intake due to inhibited breathing was causing and a slight oxygen starvation in the brain.
To summarise the data suggests that heart rate and breathing rate are not independent entities and rather coincide with each other. A slower breathing rate due to restricted air flow results in a reduced in a decreased intake of oxygen. A decreased intake in oxygen results in an increased heart rate.
However there are also other possibilities to explain the increase in heart rate and the coinciding decreasing in breathing rates. It is possible that subjects may have felt uncomfortable or nervous with the task; subconsciously the body would be alarmed at the alternated breathing situation that was imposed upon it. Nervousness may have lead to the release of epinephrine within the body resulting in a increase in both heart and breathing rates. It is possible that this would result in a increased heart rate, breathing rate would not rise because the body is physically inhibited. This possibility however is unlikely as it does not explain the exponential increase seen in figure 3, if the statement was conclusively true then heart rate should have fallen as subjects would have become more relaxed with the task.
It was commented that at increased lengths the bending of the pvc pipe increased and that it sometimes caught on to clothing or other articles. This would result in a constricted airflow slowing breathing rates, hence increasing heart rate. It is possible that it is easier to breathing through a straight pipe when compared to a curved one. The curves were greater as the length of piping increased. This would explain the extrapolation curb seen in figure 1 as the intensity of the curb would increase as the length of piping increased.
Any of the 3 suggestions could have resulted in the general increase in heart rate and the general decrease in breathing rates as the pipes increased in length. Possibly the results could have been a combination of all three factors. Regardless it is most likely being concluded that an increase in pipe length would result in an increase in heart rate due to the inhibition of breathing and the resulting slower breathing rate. This however is not considering the considerable standard deviation
If the standard deviation was taken into account then the majority of the data sets could change places damaging the validly of the hypothesis as heart and breathing rates would not necessarily increase and decrease respectively as the length of piping increased. However the reason for this large standard deviation is most likely due to a selection of students being chosen. It is near impossible to find a selection of individuals with the exact same resting heart and breathing rates. There are many aspects that have been suggested to affect heart/breathing rates including weight, height, lung capacity, ect. It would be impossible to find people who are exactly the same in all of these categories and even if it were possible, the experiment would become invalid because it only approaches one physical background of society and hence is not at all universal.Since people are so very different the acceptation of a standard deviation is required. However the validly of the experiment could be improve by increasing the sample size, or by better separating the group of year 12 students. The deviation itself does not show a trend, suggesting that it is largely random.
For all intents and purposes it is probable that increasing the length of pvc piping will result in a decreased breathing rate and hence and increased heart rate. The optimal length suggested in the hypothesis was 50cm. Out of the different lengths available 50cm would probably be the most responsible. Breathing rates passed recommended limits at 75 cm (below 16 breaths per minute), therefore the most responsible in the respect would be 50cm. Heart rate only passed over the recommended 100 beat per minute limit at 100cm. However 50cm should still be used because it would be irresponsible to disregarded breathing limits in favour or heart rate and vice versa. If optimal length is to be better explored it could be suggested that a larger discrepancy is made between sample 50cm and 75cm to find the absolute optimal point. In the reality this explored should be related to the design of breathing apparatus. From the data acquired a breathing apparatus should be between the lengths of 50cm and 75cm to best optimize the length without endangering the consumers well being. However factors such as personal deviation, the situation in which the breathing apparatus would be used (underwater, on land, ect) and the intensity of the physical task the breathing apparatus would be used for would need to be considered. Further experiments based upon this report could be used to find optimal lengths for breathing apparatus in different fields. These optimal limits could become industry standards which would ensure that consumers operate at peak efficiency without becoming personally endangered.
3.2.0- Limitation of experimental design
One of the most prevalent limitations throughout the experiment was that of the large standard deviation.
This deviation was due to large variance between individual samples which can be contributed to human variance. Heart rate if affected by many factors such as weight and height. In an experiment were the subject in question is controlled a standard deviation is normally suggestive of a random error that can be remedied by increasing the sample size.
However since humans are naturally different a large sample size will not repair the large standard deviation and may in fact make it worse. Figure 3 and 4 show that the standard deviation lacks a trend and hence is largely random. However a larger sample would mean that the average is more valid.
The group male students aged 16-17 encompasses a very broad range of people. It may be viable to further separate students based upon factors such as height or weight, this would allow the experimenter to observe if correlation exists between samples of similar physical characteristics. This could improve real world application as optimal breathing and heart rates may differ between people of different physical conditions.
Due to the increasing length of the pipes the concavity of those given pipes increased as well. This lead to bending and occasionally obstructions in the intake line which may have affected the inhalation of air. This could be remedied by either using a different material for the piping (one with a solid structure) or by having a second experimenter hold the pipe in order to keep it straight. The timing of the experiment may also have been inappropriate.
The experiment was held at the beginning of a break period meaning that some subjects may have needed to rush in order to make it in time to the experiment site. This would have resulted in an increased heart rate and breathing rate in the beginning of the experiment. To prevent this issue the experiment should perhaps not be held under time constraints so that subjects do not have to rush in order to make deadlines.
When the subject first started breathing through piping it is possible that they entered a state of subconscious nervousness due to altered breathing patters. This nervousness would result in an increased heart rate but not breathing rate as the pvc pipe would physically inhibit and increase in breathing rate (providing that subjects to not hyperventilate). To prevent this subject should be asked to breathing through the same condition twice with the second set of data being recorded
This would allow time for the body to become use to altered breathing conditions. It was commented in the qualitative data that some subjects showed signs of increased awareness when breathing through the piping. This may have resulted in them being commanded by the experimenter to emulate a specific breathing patter (in through the nose, out through the mouth). Some subjects may have needed to actively think about this pattern (concentration).
Concentration increases activity in the brain hence increasing the brain’s requirement for oxygen which may have resulted in a heart rate increase. Subjects should perhaps be tailored prior to the experiment on a proper pattern of breathing in which they must emulate not only in the pipe experiments but also in the control. This suggestion however must not be taken lightly as enforcing an alternate breathing pattern would remove the personal deviance from the experiment, this would mean that the experiment may not be valid in the real world as the experimenter demands abnormal conditions from subjects.
The time between subsequent conditions may also not have been appropriate. If heart rate did increase under pipe breathing conditions it may take a specific length of time for the heart to resume normal beating (this length of time may be longer or shorter depending on the individual). There is little to no predetermined data on how long it takes that heart to return to rest levels after it has been increased to above normal levels. Each subject was given one minute rest between lengths which may not have been sufficient. It is better to be over precautious and assume the time will be longer, based upon this argument subjects should perhaps be given increased periods of rest, to determine the ideal time of rest a separate experiment examining the time it takes subjects to return to regular pulse should be performed.
Finally the scope of the experiment itself must be considered. The experiment was dealing with optimal lengths of pvc piping which could be employed in the breathing apparatus industry. However the experiment only examined the group “males ages 16-17”. In future experiments other age and sex groups should also be examined to determine if optimal lengths change between sexes and age. Understanding of optimization limits between different groups could aid in the design of breathing apparatus from individual groups or perhaps the design of the most universally balanced (average across all groups) breathing apparatus.
3.3.0 Improvements for experimental design (table 6)