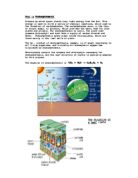
As the amount of CO2 available increases, the rate of p/s increases, until the plant is photosynthesising as fast as it can - the CSP - CO2 Saturation Point. If both CO2 and light supply are increased together, the rate of p/s will level out. Henceforth it is limited, according to Blackman’s Law, by the factor in least supply, either H2O or temperature. however there is a physical limitation of the carbon dioxide diffusion and the plant’s sunlight absorption.
At a lower temperature, the rate of p/s is increasing with increasing LI or CO2 availability, but the LSP or CSP is quickly reached. At a higher temperature, the rate of p/s increased further and reaches the LSP / CSP slower. Thus we can se that temperature affects the rate of p/s - it is higher at higher temperatures.
From this information, one can see that if one wants to investigate solely the effect of the quantity of light on Elodea, one must keep both the amount of CO2 and the temperature constant.
Light intensity will decrease as the distance between the light source and the object increases, and vice versa.
Thus the relationship between LI and distance can be described as
1 This value will be very small; multiplying the LI 1000
LI = –––– by 1000 makes the LI a more ‘workable’ number. LI = ––––––
D2 D2
ie. Light intensity is inversely proportional to the square of the distance
Now, I must use this information to make a hypothesis and a plan for the experiment.
hypothesis
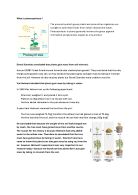
I believe that as the LI is increased, the rate of photosynthesis will increase fairly constantly as long as the other limiting factors of p/s are kept constant. This is because increasing the LI (unto the LSP) causes an increase of the rate of p/s, until the plant is photosynthesising as fast as it can, as long as changing the LI is the only variable of the experiment. If there are other variables at the same time as the varying light intensity, this will affect the rate of photosynthesis, and prevent the experiment from being a fair test.
planning
- The apparatus used will be as follows:
- Clamp stand etc.
- Beaker (Water bath)
- Boiling tube
-
0.5% Na+ HCO3- solution
-
Elodea Candensis specimen
- Electric bench lamp with 100W filament bulb
- Thermometer
- Plasticene / Blu-Tac / Paperclip
- Stopwatch
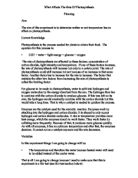
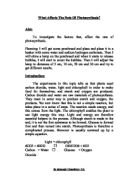
The apparatus will be set up as follows.
The water bath is used to keep the temperature constant - the water bath absorbs the heat from the lamp and thus prevents the Elodea specimen from photosynthesising at a faster rate due to temperature increase. The Na+HCO3- releases a constant supply of CO2 for p/s. The Elodea specimen is inverted so that the CO2 can be released more easily - the CO2 is released by the stomata which are on the underside of the leaf of the plant. Thus when the plant is inverted, the CO2 is not trapped beneath the plant’s leaf, and is free to move. The Blu-Tac / Plasticene / paperclip is used to weigh down the Elodea specimen in the boiling tube.. This makes sure that the entire plant is submerged in the Na+HCO3- solution and therefore the entire plant is exposed to the CO2 released by the Na+HCO3-. However, this weight covers as few leaves as possible, thus reducing the chance that the CO2 production / release will be interfered with. Also, the weight must not cover the very tip of specimen, the meristem; this tip of the plant is where the plant is growing the most, and thus photosynthesising the most. The end of the plant should be cut at an angle, in order to release CO2 most effectively. The thermometer monitors the temperature of the water bath, thus checking whether or not there is a temperature increase or decrease, resulting in the change in the rate of p/s in the Elodea specimen. A change in the temperature would prevent the investigation from being a fair test. Hence, maintaining a constant temperature and CO2 level maintains a fair test, with only one variable changing - the LI. Counting the number of bubbles produced by the Elodea would be a fairly reliable way of measuring the CO2 produced. Obviously affixing a gas syringe to the top of the boiling tube would be far more reliable, but I doubt that there would be a sufficient volume of CO2 in a short time (max 3 mins) produced to make a considerable difference when reading the volume of gas produced by the Elodea specimen. By counting the number of bubbles, we are assured of a sufficiently large reading. The Elodea must be left for a sufficient amount of time for it to adjust to the new LI; I believe that five minutes should be ample enough - this will be consolidated by the preliminary results. Repeat readings must be taken to establish that there are no anomalous results - two extra readings should be sufficient (again the number will be determined by the preliminary results). The repeat readings will be taken after the original reading has been taken in the same manner as the original result. Anomalous results (if there are any) should be ascertained by the repeat readings.
In this experiment, there is little opportunity for accidents; however, the lamp will get somewhat hot during the experiment, and one must be careful not to burn oneself during the experiment. Also, utmost care must be taken, as ever, when working with glass apparatus, due to the risk of the shattering of the glass leading to injury.
The method will be as follows:
- Set up apparatus as in diagram
-
Leave the cut Elodea for five minutes to adjust to the altered LI
-
Record the numbers of bubbles of CO2 produced in one minute
Preliminary results
Using this setup and apparatus, I encountered the following problems:
9cm of Elodea did not fit into the boiling tube. Hence, the length of the specimen was reduced to 7cm, which did fit into the boiling tube. Five minutes was left for the Elodea to adjust to the LI. Then the number of bubbles of CO2 produced in a minute by the Elodea was measured. Two repeat readings were taken, and the three results averaged out. The averages are:
Distance / cm LI (1000÷D2) Bubbles / min Temp of water bath / ºc
5 40 immeasurable 26
10 10 immeasurable 25
15 4.444 (to 3dp) 46 22
…
35 0.816 (to 3dp) 16 22
40 0.625 9 22
45 0.494 (to 3 dp) ½ 22
When the distances were less than 15cm, there were so many bubbles produced that it was impossible to count them, and also, the temperature was raised, thus preventing the experiment from being a fair test. However, at 15cm, it was possible to count the number of bubbles produced, and from this point onwards, the temperature remained constant. Ergo, I will take readings from 15cm onwards. Yet, when the distances were more than 40cm, there was only a maximum of one bubble produced every other minute (ie. ½ a bubble per minute). As this is less than 1, I have chosen to ignore readings of d³40cm.
The 5 minutes adjustment time appears to have worked, as the readings are constant. Hence this time will be kept the same in the final experiment.
Consequently, I will change the following:
- I will take measurements between 15cm and up to 40cm inclusive only
- I will use 7cm of Elodea
Method
The apparatus was set up as in the planned diagram. The lamp was set fifteen centimetres from the Elodea specimen, and the specimen was allowed to adjust to the new light intensity for five minutes. Then amount of bubbles produced in one minute were counted. This was repeated twice, and the distance increased by five centimetres. The plant was left to adjust, readings taken and the distance changed up to 30 cm, this being the only number of measurements time allowed.
Results
The followings results were obtained
Distance / cm LI (1000÷D2) Bubbles / min Temp of water bath / ºc Observations
15 ü 56 22 22 Bubbles
15 ý 4.444 63 22 22 produced
15 þ 57 22 22 erratically
20 ü 49 22 22 Steady
20 ý 2.5 49 22 22 stream of
20 þ 51 22 22 bubbles
25 ü 33 22 22
25 ý 1.6 37 22 22 None
25 þ 40 22 22
30 ü 22 22 22
30 ý 1.111 24 22 22 None
30 þ 21 22 22
Average - plot points
These results have been plotted on graph paper
Analysis / conclusion
From the graphs we can see that as light intensity increases, the production of CO2 increases (and thus the rate of photosynthesis) unto the LSP (Light Saturation Point). The graphs suggest that the LSP for Elodea is when the LI » 4.5. Thus the distance at which the Elodea should reach its LSP is:
1000
LI = ———
d2
\ d = Ö 1000 ÷ LI
\ Ö (1000 ÷ 4.5) º 14.90711985 » 15
Thus, one could predict that at distances less than ~15 cm (and therefore light intensities greater than ~4.5) the number of bubbles of CO2 produced by an Elodea specimen would be approximately uniform.
When it comes to the slightly anomalous result shown on the LI vs. Bpm graph, there is a simple way to explain this; Elodea is a living organism, and no living organism follows a regimented pattern. Thus we can say that this anomaly is due to the specimen being not entirely infallible.
As I predicted, the rate of photosynthesis increased constantly unto the LSP because all limiting factors, other than light, were kept consistently the same. Thus these results support my prediction.
Evaluation
I feel that this experiment has been successful in fulfilling the objective. The planned procedure worked fairly well, needing only a few minor adjustments to obtain good results. The evidence obtained supports photosynthetic theory and my prediction; it appears to be sound.
As mentioned before, the only (slightly) anomalous result is simple to explain; Elodea, being a living organism will not produce uniform results - thus the anomaly, it can be said, is due to the fallibility of the specimen.
No problems were encountered; the only circumstance which would have been a difficulty would have been controlling the temperature. However, this was eliminated by putting the boiling tube into a water bath which absorbed the majority of the heat energy from the lamp, and by keeping the specimen far away enough from the lamp for there to be no significant change in temperature.
This experiment is rather crude, and the method of measuring the rate of photosynthesis especially; counting the number of bubble of CO2 produced in a minute is not very accurate - measuring a volume would be far more precise, but the time for a reasonable amount of CO2 to be produced would be rather long, I feel; this would be inappropriate I believe, where time is limited.
Further work could be carried out, investigating the effects of the quality of light on the rate of photosynthesis; different coloured light for example could be used. This could be of commercial benefit, as finding out the effect of the colour of light on the rate of photosynthesis could aid plant growers to find out which type(s) of light make(s) plants grow quickest.