It was quite exciting to watch the reaction for the temperature of about 90ºC. Almost immediately after mixing the liquids and starting the stopwatch, the color had completely disappeared – in the blink of an eye.
Generally we found that as we increased the temperature of the water baths that we were immersing the permanganate and oxalic acid in, the rates of reaction steadily increased. No smell was derived from this process, and the beaker did feel a little warm on the outside, thus it was an exothermic reaction.
Data Processing:
Graph 1: Temperature (K) vs. Time (sec)
As we can see from the above graph, the relationship between temperature (K) and time (sec) is clearly not of a linear nature. This makes sense, because when we take the tangent to the curve on the graph above, we will have the rate of each reaction. We know that by increasing the temperature, since temperature is proportional to the average kinetic energy of the particles, the number of collisions will increase as well as the energy of the particles themselves – so more particles have sufficient energy to overcome the activation energy barrier and undergo successful collisions. This in turn means that the rate of reaction will increase with the temperature. Because of this presumed knowledge, if the graph of temperature vs. time was indeed linear, then the tangents would all be equal (meaning the rates would all be equal) and we clearly know this is not the case. From the graph above, visually we can see that if we were to draw tangents at each of the red points, each one would have a different value, as it should.
Graph 2: Temperature (K) vs. Rate (Ksec-1)
Again from the graph, we can see that the temperature (K) and rate (Ksec-1) do not have a linear relationship. It is generally observed that a 10ºC increase in temperature doubles the reaction rate: given this, we automatically know that the relationship cannot be linear, and must be exponential.
Graph 3: ln(Rate) vs. 1/Temp (K)
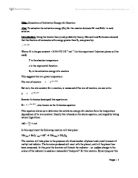
The natural logarithm of the rate and the reciprocal of the absolute temperature (K) do have a linear relationship. Given the Arrhenius equation, this graph shows the relationship between time and temperature in the reactions: as the absolute temperature increases, more of the reactants possess enough energy to overcome the activation energy barrier and thus the rate constant increases. On the graph above, the gradient is equal to, and we can see the calculated value of the y-intercept from the Graphical Analysis software is 20.14.
- Calculate the activation energy for the reaction using the data from the data table:
Conclusion and Evaluation:
From this experiment, I learned how to determine the activation energy of a reaction graphically. I was also able to learn, from the Arrhenius equation, a graphical interpretation of the relationships between temperature and time and temperature and rate.
Although I did not calculate a percent error for this experiment, the uncertainty evident in my raw data collection still serves to show that there were sources of error. Firstly, in terms of systematic error, one was the equipment, specifically the test tubes used. They were varying in size, and inside some of them there was still leftover “gunk” from other experiments – despite our best efforts to clean them. Another source of error could be the accuracy of the thermometer: even though we were consistent in the thermometer we used, we had to share 1 between 3 water baths, therefore maybe we didn’t allow enough time for it to absorb or readjust to the varying temperature conditions. A source of random error could be the heat loss between the time we took the test tubes out of the water bath to when we actually mixed them: even though we heated them to a constant temperature, in the time that it took to mix the two contents together and stir, some heat was probably lost.