The Effect of the Particle Size on the Rate of Reaction
CaCO3 (s) + 2HCl(aq) → H2O (l) + CO2 (g) + CaCl(aq)
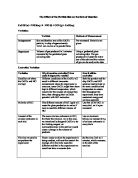
Variables:
Controlled Variables:

Observation:
Quantitative: Data Collection
Table 1: Amount of CO2 produced from the reaction between 0.6 g of CaCO3 chips and 8 ml of 2M HCl over 3 trials and the mean, in intervals of every 10 seconds. The uncertainty is 0.05 ml as the readings are analog and the smallest unit is 0.1 ml
Sample Calculation:
Finding the Mean:
Table 2: Amount of CO2 produced from the reaction between 0.6 g of CaCO3 powder and 8 ml of 2M HCl over 3 trials ...
This is a preview of the whole essay
Observation:
Quantitative: Data Collection
Table 1: Amount of CO2 produced from the reaction between 0.6 g of CaCO3 chips and 8 ml of 2M HCl over 3 trials and the mean, in intervals of every 10 seconds. The uncertainty is 0.05 ml as the readings are analog and the smallest unit is 0.1 ml
Sample Calculation:
Finding the Mean:
Table 2: Amount of CO2 produced from the reaction between 0.6 g of CaCO3 powder and 8 ml of 2M HCl over 3 trials and the mean, in intervals of every 10 seconds. The uncertainty is 0.05 ml as the readings are analog and the smallest unit is 0.1 ml
Analysis
Figure 1: Amount of CO2 released from the reaction between HCl and CaCO3 Powder—a scatter graph of raw data collected over 3 trials showing volume of CO2 as the independent variable and how it changes over a period of 180 second. Error Bars represent uncertainty(±0.05 mL)
Figure 2: Amount of CO2 released from the reaction between HCl and CaCO3 Chips—a scatter graph of raw data collected over 3 trials showing volume of CO2 as the independent variable and how it changes over a period of 180 seconds. Error bars represent uncertainty(±0.05 mL)
These 2 graphs above depict that the reaction occur fastest at the beginning, where there was the most amount of HCl and CaCO3, which are the reactants, as indicated by the slopes of both graphs. Then the rate of reaction decreases as time increases because less CaCO3 molecules are available to collide with HCl molecules. In the first graph, we can see that the reaction completely stops by the end of 180s as the slope is completely flat at the end However, the reaction has not stopped for the chips after 180s as the graph still has an upward slope, suggesting that not all reactants have been use, and the setup still has more potential for more chemical reaction. Therefore, we can deduce that the reaction for the CaCO3 chips last longer than the powder.
Conclusion and Evaluation
The result of the experiment has proven that increasing the surface area of a particle can result in increasing its rate of reaction when it is exposed to an environment where a reaction can occur. By looking at the graphs, we can observe that the graphs of the powdered CaCO3 have steeper slopes than the one with the chips. The result shows that by substituting the CaCO3 chips with one that is powdered, the initial reaction rate doubled, from 0.51 mL/s to 1.18 mL/s.
By substituting the marbled chips with the CaCO3 powder, the surface area significantly increases because the mass remains the same, as it is the controlled variable, but the size of each particle decreases significantly, thus allowing more surface area to be exposed to other molecules. This allows more collision of molecules to occur, as they can only collide with the surface of the solid, thus increasing the number of successful collision. This causes more products to be made in a given time.
Even though the procedure and materials required for the experiment had been carefully laid out beforehand, the experiment was not conducted without any flaws. Apart from human measurement error, other unexpected errors, such as measurement errors, and other setup errors, arise as the lab progress
The main error in this experiment is presumably the loss of gas. This happens in multiple ways. Some gas was stuck in the rubber tube, even when the reaction is finished, and was not released. Gas also takes time to travel through the tube, as the tube is bent and the gas was only pushed in 1 way. This problem can be very hard to solve, as the rubber tube has to be bent in order to get accurate readings of the gas, however, it could be treated with a shorter rubber tube so that it does not take as long for the gas to travel from the flask to the graduated glass tube
When the rubber tube was submerged in water, water travels into the tube. Therefore, when gas travels through, it cannot simply go through directly as water blocks its way. The CO2 gas needed to build up enough pressure to overcome the water in order to go through. This causes the gas to travel inconsistently, and making the result inconsistent as well. This could be solved by changing the direction of the tube and using a shorter tube.
Another cause for loss of gas is the inability to capture the gas immediately as the reaction starts. As soon as HCl is poured into the flask with CaCO3, the reaction starts and produces CO2, water, and CaCl, however, the flask has to be opened in order to transfer the solution, and some gas may be lost in that opening. This is very important as the beginning section is where the rate of reaction is the greatest. This can be solved by using teabags or other similar methods to separate the reactants without exposing them to the environment.
Another major error in the experiment is the size of the CaCO3 chips. As mentioned in the qualitative observation, some marble chips are larger than others, causing that trial to have less surface area while having the same mass. As discussed above, this could potentially cause the reaction to be much slower due to less collision. This can be solved by using a large chips that we can cut by ourselves so that we can control the size, surface area, and volume of the reactants