Pressure at which the reaction occurs (1 atm)
Apparatus List:
- Manganese (V) Oxide – 100g
-
Hydrogen Peroxide (3%) – 500cm3
- Conical Flask X1
-
Beaker (100cm3) X1
- Dropper X1
- Stopwatch X1
- Spatula X1
- Distilled Water
- Electronic Mass Balance
-
Measuring Cylinder (10cm3)
- Funnel X1
Methods:
To measure the mass of Manganese (V) Oxide:
- Measure mass of conical flask using the electronic mass balance.
- Add in Manganese (V) Oxide until the mass of the conical flask and its contents increases by 1 gram.
- Do the same for the variables of 2, 3, 4 and 5 grams.
To measure the volume of Hydrogen Peroxide:
-
Pour Hydrogen Peroxide into the measuring cylinder until it hits the 10cm3 mark.
-
Use the dropper to drip the hydrogen peroxide to get a precise value of 10cm3.
Carrying out the experiment:
- Using the funnel, pour the hydrogen peroxide into the conical flask containing the manganese (V) oxide.
- Start the stopwatch once all the hydrogen peroxide has come into contact with the manganese (V) oxide.
- Stop the stopwatch when the reaction ceases to produce any more effervescence
- Wash out the conical flask with distilled water and dry with a cloth.
- Repeats steps 1-4 for the different variables 1,2,3,4 and 5 grams.
Data Collected:
Masses of conical flasks used (g): 67.4, 67.0
Observations and Results:
While conducting the experiment, I observed that once the hydrogen peroxide comes into contact with the manganese (V) oxide the decomposition of hydrogen peroxide would begin very quickly. The mixture turns grey colour and produces a lot of effervescence. A slightly pungent odour is also produced. I stop the stopwatch when the reaction ceases to further produce effervescence and all that is left is a grey mixture. The sides of the conical flask are also coated with this grey substance. I believe that the grey substance is the manganese (V) oxide used as the catalyst because catalysts remain chemically unchanged after the catalysing a reaction.
Calculations:
Average time = (T1 + T2 + T3)/3
Uncertainties:
Calculating the uncertainties for the test using 1 g of manganese (V) oxide:
0.05/1 X 100% = 5%
2/60.4 X 100% = 3.3%
5% + 3.3% = 8.3%
Calculating the uncertainties for the test using 2 g of manganese (V) oxide:
0.05/2 X 100% = 2.5%
2/51.1 X 100% = 3.9%
2.5% + 3.9% = 6.4%
Calculating the uncertainties for the test using 3 g of manganese (V) oxide:
0.05/3 X 100% = 1.67%
2/46.7 X 100% = 4.3%
1.67% + 4.3% =5.97% = 6%
Calculating the uncertainties for the test using 4 g of manganese (V) oxide:
0.05/4 X 100% = 1.25%
2/43.30 X 100% = 4.6%
1.25% + 4.6% = 5.85% = 5.9%
Calculating the uncertainties for the test using 5 g of manganese (V) oxide:
0.05/5 X 100% = 1%
2/42.6 X 100% = 4.7%
1% + 4.7% = 5.7%
Table of Uncertainties:
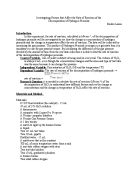
Graph of Mass of Manganese (V) Oxide used against Average Time Taken for Reaction to Stop(S):
Comments on the Graph:
As predicted in my hypothesis, the more manganese (V) oxide I used, the faster the rate of decomposition of the hydrogen peroxide. There would also be a point where anymore catalyst added would not make the reaction go any faster and this happens between 4-5 grams of catalyst added and onwards.
However, I am unable to ascertain this because I did not conduct more experiments for variables of 6g of manganese (V) oxide and onwards. This means that although for my graph, the gradient has become very small, I still am not able to neglect it because there is a possibility that adding more catalyst might still increase the rate of reaction. However, judging from the gradient of the curve, I can say that the increase of the rate of reaction will be very small and that it can be neglected. However to ascertain this I still should have conducted my experiment using more variables.
Conclusion:
My aim for this experiment was to investigate how the mass of catalyst used would affect the rate of the catalysed decomposition of hydrogen peroxide. By conducting this experiment, using manganese (V) oxide as the catalyst, I am able to conclude that from the data collected, that the more catalyst used would result in an increase in the rate at which hydrogen peroxide decomposes. However, as in accordance to my hypothesis, there would be a point where any more catalyst added would prove to be useless because the rate of reaction would be at its peak. This is shown by the graph where the mass of catalyst used is being plotted against the time taken for the reaction to finish. The graph displays a curve that is gradually becoming a straight line. The point where it becomes a straight line is where the rate of decomposition has reached its peak.
The data I have collected allows me to come to this conclusion but it does not allow me to ascertain it. This is because of the fact that I did not conduct the experiment using enough variables and thus cannot be totally sure that adding any more catalyst would not increase the rate of reaction.
This result is logical because, as I mentioned earlier, catalysts do not alter the rate of reaction any further than overcoming activation energy. To make this clearer, it means that catalysts only help to overcome activation energy in order to conserve the rest of the energy for the reaction. The more energy there is left the faster the reaction will be. This would explain why adding more catalyst causes an increase in the rate of decomposition. To explain the straight line, there would be a point where the activation energy would be overcome by a certain mass of catalyst used. Since catalyst only serve to help overcome activation energy, adding any more would result in no further change in the rate of decomposition. Thus there would be a point in the graph where an asymptote is generated because the rate at which the hydrogen peroxide decomposes cannot be increased any further. However, as mentioned above, more variables are needed to completely ascertain this.
Thus, from the results I have obtained, I can conclude that the rate of the catalytic decomposition of hydrogen peroxide increases as you add more catalyst. The point where the catalyst serves no purpose in increasing the rate of reaction needs to be further investigated due to my lack of values.
Evaluation:
Despite nearly getting the results that I hypothesized, the experiment that I conducted is filled with flaws and errors. Being far from ideal, there could be many ways in which to improve my experiment in order to assure more accurate and reliable results.
The first of the major flaws in my experiment is that I assume once the reaction stops producing effervescence; it means that the reaction has stopped. This could cause inaccurate results because the reaction could still continue but not produce any more effervescence. Thus, this means that there would be large uncertainties in my data. To solve this problem, I should have used something else as my dependent variable, something else which is easier to determine. I could have set a fixed time for the reaction and measured the mass of content remaining in the conical flask; this could show how much hydrogen peroxide has decomposed within the time limit. The independent variable would still be the mass of catalyst added and the aim would be to see how much hydrogen peroxide could decompose within a fixed time for different masses of manganese (V) oxide used.
Another flaw is that I used very little hydrogen peroxide (10cm3). This is a very minute amount and this could also mean that the amount of catalyst needed to totally overcome activation energy is much less and thus I cannot conclude exactly what value of catalyst would cause a peak in the rate of decomposition. A solution for this is to use various values of hydrogen peroxide and find the average mass of catalyst added relative to volume of hydrogen peroxide used and I could then come up with a general equation to find the peak decomposition rates for specific volumes.
The last flaw in my experiment, which I briefly mentioned in the conclusion, is the fact that I did not use enough variables for the mass of manganese (V) oxide. I only used values of 1 gram – 5 grams and thus I could not ascertain results for variables where the mass is more than that of 5 grams. Had I expanded my range from 5 grams to 10 grams, I could have a wider range of data and even might be able to achieve the perfectly straight line in my graph which I hypothesised.
Thus, I can say that this experiment has many flaws and could be improved in many areas especially in data recording.
Bibliography:
Wikipedia. Catalysis – Wikipedia, the free encyclopaedia.
Viewed on 18th August 2009
Purchon. Catalysts
Viewed on 18th August 2009