*This amount of HCl was made differently than the others in data table. (See steps1-3)
Observations:
-The 12M HCl had a very harsh, fumy smell.
-While cutting the magnesium ribbon I noticed the cutting was causing chipping in the ribbon pieces.
-When I added one of the Mg segments into the first 12M HCl it started to bubble and dissolve fairly quickly. It stayed on the surface bubbling around the sides of the beaker. The following two trials were very similar.
-I now had to make a new solution with the 12M HCl in order to make smaller concentrations of it.
-When I started with the first trial with the new HCl and I dropped the piece of magnesium into I noticed that it was very similar to the previous trials with the other concentration, but it was dissolving less swiftly and actually completely dissolved close to a minute longer. The following to trials lasted a bit shorter.
-I now had to add more water to the new solution to dilute the concentration further. The time it took for the magnesium to dissolve completely for all three trials stayed fairly constant but quite a bit higher than the previous concentration. It showed a larger growth in time than the previous tests.
-I now diluted further and again, the results showed a rather larger growth. The three trials were quite a deal less consistent than previous test. During this specific test I noticed that the pieces of Mg in the last two trials actually sunk to the bottom of the beaker. This was the first time they had done this throughout this entire experiment.
-For my last test in this experiment I diluted even further and I noticed again, that the change in time from the previous tests was even more dramatic. I think this could be an example of exponential growth. During the first trial the piece of magnesium sunk to the bottom, but the last two did not.
Data Processing:
I will be use my data to find the concentrations of HCl for each test using the simple M1V1 = M2V2 formula that uses the first volume multiplied by the original concentration to equal the final volume multiplied by the new concentration.
Since I added 15mL of 12M acid to 135 mL of water to use doing during my first test I will set up the formula as follows:
(15mL)×(12M) = (135mL + 15mL) ×(new concentration).
Then I will just multiply and divide to get the answer: 1.2M
Due to the fact that I used the same solution to make the rest of the test’s solutions, the concentration found in this equation will be used in the remaining four calculations of the concentration of HCl.
(35mL) )×(12M) = (385mL + 35mL) ×(new concentration).
New concentration=1M
Now I will use this new concentration to determine the four tests. However, since I did not add any water to the 2nd test I can say that the concentration is simply 1M.
3rd test: (40mL)×(1M) = (50mL)×(new concentration)
New concentration: 0.8M
4th test: (30mL) ×(1M) = (50mL)×(new concentration)
New concentration: 0.6M
5th test: (20mL) ×(1M) = (50mL)×(new concentration)
New concentration: 0.4M
Now I am going to average the times of each test. I will also calculate the uncertainties for these values as well.
1st test: 60.53 + 59.58 + 58.70 = 178.81 (± 0.04s) /3 =59.60 seconds(± .01s)
2nd test: 107.34 + 88.62 + 83.73 = 279.69(± 0.04s) /3 = 93.23 seconds(± .01s)
3rd test: 163.06 + 168.44 +172.20 = 503.7(± 0.04s) /3 = 167.9 seconds(± .01s)
4th test: 515.48 + 420.00+ 454.30 = 1389.78(± 0.04s) /3 =463.26 seconds(± .01s)
5th test: 884.57 +1019.63 +1568.62 = 3472.82(± 0.04s) +/3=1157.61 seconds(± .01s)
I know will need to find the concentration of the magnesium in the solution. To do this I will first need to calculate the amount of grams per 1 cm piece so I can from there find the amount moles of each piece. I will then take that amount of moles and divide by the amount of liters it is being dissolved in using the following formula: mol/volume(Liters)=M(concentration). I will find uncertainties for this as well.
To find the approximate mass of each centimeter of magnesium ribbon I will just divide the mass of 15 cm by 15.0± 0.1cm.
(0.28 ± .01)/(15.0 ± 0.1) =0.0187
(0.01/0.28) + (0.1/15.0) =0.04238 × .0187=0.000791
Mass of 1cm of Mg Ribbon = 0.0187 grams ± .0008 grams
I now need to calculate the moles of this amount to do this I will need to divide by the molar mass of magnesium which is 24.31 G/mol.
(0.0187 ± .0008)/24.31 = 0.000769 moles
(.0008/.0187) × 0.000769 = .0000329
Moles of 1cm of Mg: 0.00077 moles ± .0.00003 moles
Now I am able to calculate the concentration of Magnesium in the solution. Since each test uses the same volume of 50mL, I can use the same concentration for each test.
First I have to turn the volume into liters. There is one liter to every 1000 milliliter. Therefore, simply dividing 50mL by 1000 will suffice.
(50mL ± 0.1mL)/1000= .05L
(.1/50)=.002 × .05 = .0001
Volume: 0.0500L ± .0001L
Now I can determine concentration by dividing the moles by liters.
(0.00077 moles ± .0.00003 moles )/(0.0500L ± .0001L)= .015
(.00003/.00077) + (.0001/.05) = 0.04096 × .015 = 0.000573
Concentration of Magnesium: 0.0154M ± .0006M
Given that the original concentration of Mg is zero we can state the change in concentration simply equals 0.0154M ± .0006M
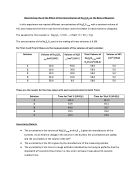
I can now use this concentration to find the rate of each test. I will use the formula (Δ Concentration/time)
To represent this data, I will make a graph that will show the effect of concentration of HCl on rate. The following table will show the values I am going to use for the graph.
Conclusion: From my results in this experiment I can conclude that the higher the concentration the higher the rate will be. Based on this graph I also can assume that the data is exponential due to the curve of the values. However, I think there were errors in the experiment that were due to I wasn’t able to measure the magnesium in its individual 1cm pieces of ribbon. I think that caused the rate to possibly be more of an estimation than it’s actual. In my 4th test 1st trial the time it took for the magnesium to dissolve was remarkable different than the other two trials. I did not observe any difference than the fact the latter two trials had ribbon that sunk to the bottom of the beaker. I think that having the ribbon more emerged in the solution can cause there to be a decrease in time.
Evaluation: I think a weakness in this experiment was I don’t think I controlled enough variables. For example, if I had forced all pieces to be fully emerged like a few that happened in the end of the experiment, my data would have more consistent.