Economics Assignment Rishika Assomull
Using demand and supply analysis, explain how resources are allocated through changes in a market economy.
We are all aware of the fact that in this world, there are limited or scarce resources. We have infinite wants, but we cannot have it all, so we have to pay an opportunity cost being something sacrificed in order to gain something else. In an economy, those who produce goods (this case being individual organizations) have to know what to produce, how to produce, and for whom to produce to satisfy consumer desires with their resources of land labor and capital.
Markets are usually a good way to organize economic activity as individual firms allocate resources through the decentralized decisions of who they interact with each other. All individual firms aim to make profit, but the forces of demand and supply control the profit. Market forces of consumers and producers determine the price of goods and services. There is perfect competition, causing the prices of the goods to be constantly remaining the equilibrium of supply and demand - this way consumer preferences influence demand curves which translates into prices, and suppliers react to the prices so they can alter their factors of production according to what the consumer's desire.
As prices increase, the demand for the goods decreases, so there is a contraction in the demand curve. Likewise, if price decreases, quantity demanded of the good increases as people can afford it more, and there is an extension in the demand curve. So firms have to establish the price fairly, and make no more than a normal profit. Firms aim to gain profit, so instead of maximizing their profits to gain supernormal profits, they try to cut costs by utilizing as minimum resources at the same time producing the maximum possible output with those resources.
Demand curves can shift according to the price of complimentary or substitute good, the income of the population, and taste changes. Supply curves can shift according to price of producer substitutes, price of factor of production, government interference of indirect taxes or subsidies, technological improvements, and natural disasters. Provide that good X and Y are substitutes, if the demand for good X increases, the demand for good Y decreases - so the demand curve of good X would shift to the right, causing the price to increase, and the demand curve of good Y would shift to the left, causing the price to decrease.
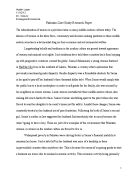
However, as price rises, firms expand their Marginal Cost (MC) curves, so the resources like land, labor, or capital are moved out of Y's industry and reallocated to X's industry because resources move out of an industry when experiencing losses. Because resources are transferred from industries with less demand to industries with more demand, there is a Production Possibility Curve where industries fully utilize their limited resources by choosing any point on the curve. It is the locus of all combinations of two goods - this encourages allocative efficiency because it provides a supply of the efficient mix of output for the consumers. Equilibrium for the firm with given resources is at the most profitable and productively efficient point on the PPF.
(Point A= firm produces more of good X and less of good Y)
(Point B= firm produces more of good Y and less of good X)
In this case, the firm chooses point B.
But when X's industry begins to make supernormal profit, there will be less demand for good X, and industry X would probably face a loss and have to allocate its resources back to industry Y. Eventually, all industries balance out until they earn normal profit i.e. when Price and Marginal cost curves are equal. This is the effect of perfect ...
This is a preview of the whole essay
(Point A= firm produces more of good X and less of good Y)
(Point B= firm produces more of good Y and less of good X)
In this case, the firm chooses point B.
But when X's industry begins to make supernormal profit, there will be less demand for good X, and industry X would probably face a loss and have to allocate its resources back to industry Y. Eventually, all industries balance out until they earn normal profit i.e. when Price and Marginal cost curves are equal. This is the effect of perfect competition - it encourages optimal and efficient allocation of resources. Excess demand would put upward pressure on the price, and excess supply would put downward pressure on the price, forcing it all back to the equilibrium quantity where Quantity demand = Quantity supplied.
-----------
Intro
Market economy
How resources are allocated
Profit motive and price mechanism
Demand and supply
Equilibrium
Excess supply and excess demand
Shift in demand
Supply shift
PPF
http://en.wikipedia.org/wiki/Supply_and_demand
The invisible hand is a metaphor coined by the economist Adam Smith to illustrate how those who seek wealth by following their individual self-interest assist society as a whole and build the common good. In The Wealth of Nations and other writings, Smith claims that, in capitalism, an individual pursuing his own good tends to also promote the good of his community, through a principle that he called "the invisible hand". Specifically, a free competitive market ensures that those goods and services perceived as most beneficial, efficient, or of highest quality will naturally be those that are most profitable. The mechanism for this, Smith saw as being the free price system.[1]
The concept of the Invisible Hand is nearly always generalized beyond Smith's original discussion of domestic versus foreign trade. Smith himself participated in such generalization, as is already evident in his allusion to "many other cases", quoted above. However Smith's message is in fact very different from the popular understanding of it; namely that greed - including the following of market price signals for the sole purpose of maximising individual profit - is best both for individuals and their communities. Rather, his message is that our social consciences lead us to re-evaluate our self-interest, without our being fully conscious of the process. [citation needed]
Notice that the invisible hand is here considered a natural inclination, not yet a social mechanism as it was later classified by Leon Walras and Vilfredo Pareto.
Many economists claim that the theory of the Invisible Hand states that if each consumer is allowed to choose freely what to buy and each producer is allowed to choose freely what to sell and how to produce it, the market will settle on a product distribution and prices that are beneficial to the all individual members of a community, and hence to the community as a whole. The reason for this is that greed will drive actors to beneficial behavior. Efficient methods of production will be adopted in order to maximize profits. Low prices will be charged in order to undercut competitors. Investors will invest in those industries that are most urgently needed to maximize returns, and withdraw capital from those that are less efficient in creating value. Students will be guided to prepare for the most needed (and therefore most remunerative) careers. And all these effects will take place dynamically and automatically.
It also works as a balancing mechanism. For example, the inhabitants of a poor country will be willing to work very cheaply. Capitalists can make great profits by building factories in poor countries. But since they increase the demand for labor, they will increase its price. And since the new producers will also become consumers, local businesses will have to hire more people in order to provide for them the things that they want to consume. As this process continues, the labor prices will eventually rise to the point at which there is no advantage for the foreign countries doing business in the formerly poor country. Overall, this mechanism will cause the local economy to function on its own.
Productive efficiency Equivalently, it is the highest possible output of one good, given the production level of the other good(s). In long-run equilibrium for a perfectly competitive markets, this is where average cost is at the lowest point on the Average Cost curve.
---
Allocative efficiency is the market condition whereby resources are allocated in a way that maximizes the net benefit attained through their use. Allocative efficiency refers to a situation in which the limited resources of a country are allocated in accordance with the wishes of consumers. An allocatively efficient economy produces an "optimal mix" of commodities. A firm is allocatively efficient when its price is equal to its marginal costs (that is, P = MC) in a perfect market.
[edit] Conditions
A firm is allocatively efficient when its price is equal to its marginal costs (P = MC) in a perfectly competitive market.
A market will be allocatively efficient if it is producing the right goods for the right people at the right price. An allocatively efficient market is therefore one which has no imperfections.
The demand curve is equal to the marginal utility curve i.e. the (private) benefit of the additional unit, while the supply curve is equal to the marginal cost curve i.e. the (private) cost of the additional unit. In a perfect market, there are no externalities, meaning that the demand curve is also equal to the social benefit of the additional unit, while the supply curve is equal to the social cost of the additional unit. Therefore, the market equilibrium, where demand meets supply, is also where marginal social benefit meets marginal social costs. At this point, net marginal social benefit is maximized, meaning this is the allocatively efficient outcome.
If a market or firm is not Pareto efficient, then it cannot be allocatively efficient. If somebody could be made better off without making any other individual worse off, then clearly net benefit is not maximized, and therefore the market is not allocatively efficient. In the same way, an allocatively efficient market or firm is Pareto efficient - net benefit is maximized, therefore no individual can be made better off without another individual being made at least as worse off.
However, it is possible to have Pareto efficiency without allocative efficiency. By shifting resources in the economy, a gain in benefit to one individual could be greater than the loss in benefit to another individual. Therefore, before such a shift, the market is not allocatively efficient, but might be Pareto efficient.
When a market fails to achieve allocative efficiency and resources are not allocated efficiently, there is said to be market failure. Market failure may occur with imperfect knowledge, differentiated goods, resource immobility, concentrated market power, insufficient production, externalities, or inequality of consumers' and producers' bargaining powers
Allocation
The division of things into shares or portions. In economics, the term refers primarily to the "allocation of resources," the process by which economic resources get allotted (apportioned, assigned) to their particular uses for directly or indirectly satisfying human wants. The allocation process in a particular society's economy is the process by which the three fundamental economic questions get answered in that society:
. What goods and services are produced (and in what quantities)?
2. By which of the various available technological means and recipes are each of these goods and services to be produced from the available land, labor and capital?
3. For whom are each of these goods and services produced? (Which specific individuals get to use/consume each unit of each good or service produced?)
Thus one may speak of "market allocation" of resources, "forcible allocation" of resources, "governmental allocation" of resources, "traditional" (or "customary") allocation of resources and so on, depending upon the kinds of social processes and incentives by which various sorts of scarce resources are allocated in the particular society under consideration.
See also:
* factors of production
www.auburn.edu/~johnspm/gloss/allocation
Diminishing returns plays an important part in the efficient allocation of resources. For efficiency, of course, we want to give more resources to the use in which they are more productive. But, as we give more resources to a particular use, we will observe diminishing returns -- that use will become less productive. That may sound frustrating, but in fact it leads to a very important principle we can apply to the problem of efficient allocation of resources.
The concept of marginal productivity is central to economists' understanding of efficient allocation of resources. For an illustrative example, consider a farmer who has two fields to plant. He can grow a crop of corn (let's say) on each of them, but has a limited amount of labor to allocate between them. Let us say that the farmer can spend 1000 hours of labor, total, on the two fields. If he spends one more hour of labor on the north field, that means he has one hour less to spend on the south field.
Here are the production functions for the two fields.
Table 2
Labor Input and Output on Two Fields
North Field
South Field
labor
output
labor
output
0
0
0
0
00
9500
00
2107
200
8000
200
23429
300
25500
300
33964
400
32000
400
43714
500
37500
500
52679
600
42000
600
60857
700
45500
700
68250
800
48000
800
74858
900
49500
900
80679
000
50000
000
85715
Production Functions for the Two Fields
We can visualize the production functions for the two fields. Figure 1, below, shows the production function for the relatively fertile south field with a vertically dashed purple curve, and the less fertile north field with a solid green curve. As we see, the south field can always produce more, with the same amount of labor, as the north field can.
Figure 3. Production Functions for Two Fields
The Problem of Allocation
The farmer's "allocation problem" is: How much labor to commit to the north field, and how much to the south field? One "common sense" approach might be to abandon the infertile north field and allocate the whole 1000 hours of labor to the south field. But a little arithmetic shows that this won't work. Here is a table that shows the correlated quantities of labor on the two fields, and the total output of corn from both fields taken together.
Table 3
Allocation of Labor
and Total Output
on Two Fields
Labor on
North Field
Labor on
South Field
total output
in bushels
of corn
0
000
85000
00
900
89600
200
800
92400
300
700
93400
400
600
92600
500
500
90000
600
400
85600
700
300
79400
800
200
71400
900
00
61600
000
0
50000
We see that the farmer gets his largest output by allocating most, but not all, of his labor to the south field. Because of the principle of diminishing returns, however, he shouldn't put all his resources into the one field, but divide the labor resource (unevenly!) between the two.
But how much should go to the north plot, and how much to the south plot?
Visualizing The Problem of Allocation
We can visualize the efficient allocation of resources with a graph like this one. The labor used on the infertile north field is measured on the horizontal axis and the total output from both fields in shown on the vertical axis. (We are assuming, of course, that all labor not used on the North field is used on the South field). The dark green curve shows how total output changes as we shift labor from the north field to the south field. Thus, the top of the curve is the interesting spot -- that's where we get the most output. In this example, that's the efficient allocation of resources between the two fields.
Figure 4: Maximum Production
It's easy to see that we should put some labor to work on the north field -- but not too much. The vertical orange line shows that the maximum output -- the top of the dark green curve -- comes when about 300 labor days are allocated to the north field and the rest, 700 labor days, to the south field. And that's exactly right.
It's pretty easy to see where the maximum is in this simple example. But in a more realistic example, in which there could be many more than just two dimensions, it's harder to visualize. We need a rule that we can apply in more complex, realistic examples, a rule that will tell us if we have or don't have an efficient allocation of resources.
That's where the economist's "marginal approach" comes in. The objective is to get to the top of the hill. You could call "the marginal approach" the "bug's-eye view." Think of yourself as a bug climbing up that production hill in the picture. How will you know when you are at the top?
william-king.www.drexel.edu/top/prin/txt/MPCh/MPex0.html