Calculate the GDP of the following country using each method of National income counting
Expenditure Method
Consumer expenditure (C) = 1 400 000, public expenditure (G) = 430 000, fixed capital formulation (I) = 400 000, exports (X) = 160 000, imports (M) = 120 000, subsidies = 30 000 and sales taxes (T) = 110 000.
Calculate GDP at market prices and GDP at factor cost
Profits received by Turkish citizens on investments made overseas 80 000. Profits repatriated from turkey 70 000. Therefore, GNP =
Income method
Income from employment = 900 000, income from self employment = 260 000, private sector profits = 100 000, public sector profits = 90 000, rent = 120 000, interest = 70 000, stock appreciation = 40 000, Statistical error = (6000)
GDP =
Net property income from abroad = 30 000. GNP =
Output Method
Agriculture = 150 000, energy 90 000, manufacturing 300 000, distribution 140 000, banking 190 000, education and health 110 000, other public services 260 000, statistical error 4000
GDP =
Net property income from abroad = 30 000. GNP =
GNP – depreciation of fixed assets =
GDP / population =
GDP – inflation (rise in prices) =
Calculate the GDP of the following country using each method of National income counting
Expenditure Method
Consumer expenditure ( C ) 400 000
Public expenditure (G) 130 000
Fixed Capital formulation (I) 70 000
Exports (X) 60 000
Imports (M) (80 000)
GDP at market prices
Sales taxes (75 000)
Subsidies 5 000
GDP at factor cost
Statistical error 2400
GDP at factor cost
Income method
Income from employment 303 000
Income from self employment 60 000
Private sector Profits 50 000
Public sector profits 40 000
Rent 50 000
Interest 40 000
Stock appreciation (30 000)
Statistical error (1000)
GDP
Output Method
Agriculture 50 000
Energy 50 000
Manufacturing 100 000
Distribution 40 000
Banking 120 000
Education and Health 80 000
Other public services 68 000
Statistical error 4000
GDP
GDP – net property income from abroad = ______- Depreciation = ____________
Real NY v nominal
Real GDP is the nominal rate of GDP – inflation to find the real level of GDP
Per capita
Real GDP / population = per capita GDP. Highest in the world = Luxemburg
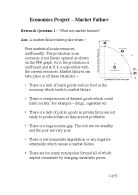
Limitations of GDP data
Comparing two countries with differing GDP levels is an indicator of development. For example, looking at the worlds richest countries, measured by GDP and looking at the worlds most developed nations, measured by HDI (human development index), the lists are very similar. Generally speaking the worlds richest nations are also the most developed.
But there are limitations to GDP data.
For instance take two countries – UK and France. The UK has the higher GDP. Does this mean that the UK is richer than France? Not necessarily as the difference is relatively small and so the differences are not significant enough to say conclusively that one is richer than the other. For instance perhaps income levels in France are more equally distributed than UK.
Perhaps UK is more expensive to live than France?
Perhaps tax rates are higher in UK?
Perhaps the informal sector is larger in France, which do not get included in the figures?
However, now lets consider two different countries – Germany and Turkey. In this case the GDP of Germany is 3 times higher per capita than Turkey. While there are limitations of GDP analysis, the vast difference between the GDP rates of each country is significantly large in order to say conclusively that Germany is a richer than Turkey.
Circular flow of NY – page 208
Macroeconomic models - Components of AD
AD = C+G+I+X-M
Consumption + government spending + investment + exports - imports
AS v AD Equilibrium level of NY
Where AS = AD
Inflationary Gap
The gap between the rate of inflation when the economy is in equilibrium and the level of inflation when AD > AS
Deflationary Gap
The gap between the rate of real GDP when the economy is in equilibrium and the level of GDP when the economy is in recession
GDP deflator
page 246
The shape of the AD / AS curve
SR keynes Monetarist
Average AS Average AS
Prices Prices
Real GDP Real GDP
LR keynes compromise
Average AS Average AS
Prices Prices
Real GDP Real GDP
Shifts in AD and AS - Caused by ?
AD shifts are caused by
Changes in tax rates and government spending (fiscal policy)
Changes in interest rates and the money supply
Rises in real GDP
A fall in the exchange rate making exports cheaper
AS shifts are caused by
A change in oil prices or other external shocks to the economy
Improvements in technology or production methods
Investments in education and training which increases productivity levels
Changes in exchange rates which makes imports more expensive
Keynesians – fiscal policy
This is the control of the economy through government spending and taxes. In recession, the government will inject money into the circular flow by lowering taxes (income tax and sales tax) and / or raising government spending
Monetarists – monetary policy
This is the control of the economy through interest rates and the money supply. In times of recession, the government should lower interest rates and in times of excessive inflation they will lower the money supply and raise interest rates.
E.g. – the average UK person earns $ 45 000 a year giving them an after tax wage, per month of $3100. The average house costs $ 230 000 meaning a mortgage of approximately $ 170 000.
Monthly payments at 5%, therefore, are $900 leaving a total disposable income of $2200. If, however, the government reduces interest rates to 2.5% then monthly mortgage payments become $450, giving every household an extra $450 a month to spend.
Between 1960 and 2009, governments throughout the world abandoned fiscal policy (Keynesianism) and just controlled the economy through interest rates (monetarism).
Supply side theorists
Supply side economists (laissez faire economists) believe that governments should not intervene in the economy as governments cannot control AD in the long run as the markets are self-correcting.
Strengths and weaknesses of these policies
The biggest strength of supply side policies are that they provide real growth in GDP / National income. Ultimately, rises in AD are limited in their effectiveness because they can only push GDP up to the PPF. In the long run, only by shifts in AS will the economy improve. E.g. Fiscal measures might make an unemployed person work. Their output leads to a rise in GDP. However, in the long run, further rises in GDP can only be sustained by increasing the productivity of that worker either by retraining or improving the technology that he or she has to work with.
Secondly, rises in GDP through shifts in AS do not increase inflation pressure. In fact they do the opposite. If an economy can increase its AS then it can even raise AD (through fiscal and monetary policy) without causing inflation.
Multiplier
The multiple by which an increase in government spending leads to a more than proportional rise in AD. E.g. government builds a road, the company hires workers and provide a contract to a cement factory etc. Those workers spend their money elsewhere, which generates additional income etc.
Accelerator
How a rise in AD will ultimately lead to a rise in investment as companies must invest to satisfy the new demand.
Crowding out
This is the crux of the Keynesian v Laissez Faire debate. Do increases in AD inevitably lead to Crowding out? Monetarists and Laissez Faire economists say it does while Keynesians say that it does not. Crowding out means when increases in government spending crowds out private sector investment. E.g. President Obama’s 1 trillion fiscal stimulus package, borrowed from the Chinese will lead to a rise in interest rates which will make it more difficult for companies and individuals to borrow money.
Economically active population
People who are willing and able to work, within the workforce. Ie the number of people employed and unemployed. Housewives, children, students and the elderly are not economically active. Sometimes called the labour force.
How is unemployment measured
The % of the labour force (economically active population) without paid employment
Unemployment – types of
Structural unemployment - unemployment caused by people lacking either the geographical or occupational skills to take the jobs that are on offer in the economy. e.g. an unemployed steel worker living in a town where the steel works have closed down.
Cyclical unemployment - unemployment caused by a down turn in the economy. To calculate the level of cyclical unemployment within an economy you subtract the level of unemployment when the economy is in equilibrium with the level of unemployment when the economy is in recession.
Frictional unemployment - unemployment caused by somebody looking for a new job.
Seasonal unemployment - a person unemployed for part of the year.
Costs of unemployment
Budget deficits as governments collect less and spend more on welfare benefits
Productivity and output falls
Higher rates of crime and social unrest / protests
Higher income inequality
Dealing with Unemployment
Worksheet – worksheet on unemployment
Macro -economics measuring national income
Cyclical unemployment – this can be overcome by fiscal policy (Keynesianism), monetary policy (monetarism) or by doing nothing and waiting for the economy to correct itself (laissez faire economists). Removing minimum wage. Increase government spending. Investment projects to stimulate the circular flow of national income.
Structural unemployment – training programs, retraining for the unemployed, reducing welfare benefits, investment in new technology
Frictional unemployment – lower bureaucratic requirements, job centers, specialist newspapers advertising the available jobs etc.
Inflation – cost-push and demand pull.
Cost push inflation
Inflation cause by rises in the AS, the same as the supply curve in micro-economics. E.g rising oil prices, higher wage demands, a rise in sales tax or a fall in the value of the currency.
Demand Pull Inflation
Inflation caused by rises in AD, the same as the demand curve in micro-economics. E.g reductions in interest rates or income tax, a rise in the money supply or an increase in the popularity of a countries products overseas.
Creeping inflation and hyper inflation (worksheet)
Laissez Faire economics v Interventionist economics
We (Turkey and most other countries around the world) are in the same position – recession’ defined as 2 consecutive quarters of negative GDP growth. Eg 2009 growth rates
World 3.8%
Poland 4% (top EU country)
Greece 2.8% (2nd highest in EU)
USA, UK, Turkey below zero
Italy, Ireland, Spain below them
So what should a country do – something or nothing?
First the nothing approach – according to Laissez faire economists, the markets are self-correcting. The background to this recession was the very high rates of inflation in the world in the period 2006 – 2008. Essentially, everybody was spending money they did not have, running up huge credit card bills and other debts. Banks, for their part, contributed to the mess by lending out money to people who couldn’t pay it back. The much mentioned – PWAJI’s (people without assets, jobs or income) who were lent money to buy their trailers when they didn’t have jobs to pay the loans back. Credit cards given to all and sundry. Therefore, inefficient businesses sprung up that shouldn’t, houses got sold that shouldn’t and prices of housing, oil, food and other commodities rose to a level that no-one could afford. Therefore, this recession is payback time.
In the recession, the inefficient businesses are failing, houses, oil, stocks etc are falling in price to a sensible level and from there the world can gradually recover.
Now the something approach (Keynesian, interventionist economists)
Keynesian economists by contrast do not see the markets as self-correcting. For them recessions are something that a government can control. Lets suppose the Turkish GDP is normally $800 billion but in 2009 fell to $700 billion the GDP gap or recessionary gap = $100 billion. Therefore, so say economists, the government needs to make up the difference. Say the value of the multiplier is 2, then the government needs to inject an additional $50 billion into the circular flow in the form of government spending or lower taxes (fiscal policy).
Eg’s
America GDP in 2008, 14.75 trillion $
2009, 13.25 trillion $
Therefore, the output gap is $ 1.5 trillion. Suppose the Americans spend 40% of their income then the multiplier effect is 1 / 0.6 = 1.66. Therefore, according to Keynesians, Obama must inject 1.5 / 1.66 = $ 900 billion into the circular flow to make up for this output gap.
Imports
Goods and Services Saving Tax
Expenditure
Injections:
Government spending
(must be increased by $900b)
Investment
Exports Factor rewards
Factors of production
Will Obama’s package work?
So should a government use Keynesian measures or not?
Advantages:
- It provides a short-term solution and much needed short-term relief.
- It provides confidence for companies to invest (accelerator theory)
- The economy, once in full employment, can generate new jobs, new -wealth etc and, therefore, new tax revenues to repay the debts incurred.
Disadvantages:
- The money injected into the circular flow through increased government spending or lowering taxes has to be repaid – the current fiscal stimulus package of USA has increased USA’s national debt by an additional 1 trillion $
- The question will always be asked – are these jobs that are created really long term jobs or merely temporary. Does the government investment not stifle private investment (crowding out) by taking away scarce resources of land, labour e.t.c
Phillips Curve
Inflation
LR Phillips curve
Q = Natural rate of unemployment
NAIRU
Q Unemployment
Quantity theory of money
Worksheet
Functions of money
Worksheet – functions and uses of money
Running the economy
Wage cost spiral
This is the explanation used to describe why governments should not artificially stimulate the economy via fiscal and monetary policy. Firstly, our economy is in equilibrium. Point A.
Average
Prices AS3
AS2
AS
AD2
A AD
LRAS
Real wage
Now what happens is the economy suffers an external shock e.g. a rise in oil prices. Aggregate Supply shifts to AS2. Our new equilibrium point is B. At this point the government can do nothing, simply biting the bullet and accepting a short-term loss of GDP. OR it can try and artificially stimulate the economy, raising AD to AD2. Unfortunately, this does not work because the resulting rise in inflation forces wage costs up further. (AS2 – AS3). This cycle brings about an inevitable consequence of recession as eventually firms are forced to lay off workers because they cannot afford to keep paying them.
Multiple-choice questions
Macro – economics work
General Revision
Taxes (Progressive v Regressive)
All governments need to tax their citizens to pay for infrastructure projects, welfare payments and transfer payments (civil service wages). The question is, which type of tax system is best, America’s regressive system or Sweden’s progressive system?
Progressive tax system Regressive tax system
Sweden Germany UK America Turkey India / Russia
France Australia
What are progressive taxes?
A progressive tax is a tax where the rich pay a higher % of their income than the poor eg income tax, luxury taxes, property taxes, corporation tax (tax on company profits)
Regressive taxes
Regressive taxes are taxes where the poor pay a higher % of their income than the rich e.g sales tax, flat rate tax on property for example, SSK.
A profile of two people, one rich, the other poor
Mehmet is a CEO and he earns, every month $50 000. By contrast, Alan is an unemployed lay about, earning $500 a month. In country A the top rate of tax is 50% with sales tax of 10%. Mehmet pays a much higher rate of tax than Alan, which is fairer. Country B has a top tax rate of 20% and sales tax of 20%. This time, both Alan and Mehmet pay roughly 20% of their income in tax. This is a much less fair system but at least Mehmet is now discouraged from his plan to live in Dubai to avoid taxes.
Income inequality
This is measured by the gini co-efficient
Laffer Curve
Tax rate
Tax revenue collected
Lorenz Curve
% of the wealth
owned
A
B
poorest % of population
Gini co efficient is calculated by A / (A + B)
Communist Utopia (red)
Alanopia (purple) (corrupt African dictatorship)
Mehmetopia (western European country)
Therefore, our gini co-efficient in our communist utopia = 1
In Alanopia the gini co-efficient is very low ie 0.1 – 0.2 the poorest 50% earn just 5% of the wealth (5 / 50)
By contrast, in Mehmetopia the gini co- efficient is 0.5 meaning that the bottom 50% own 25% of the wealth (25 / 50)